


Very useful feature!
First I was really surprised to know that I was 53.4% Baltic, but now I can see that Russia is 77.3% Baltic so it is not unusual for a Russian to be Baltic at all
New Feature: Ethnicities Around the World
Now that MyHeritage DNA has surpassed one million people in the DNA database — we’re releasing a fun and original feature based on aggregated, anonymous ethnicity data from our users. The new feature, Ethnicities around the world, allows you to explore the most common ethnicities in different countries, and the top countries for each ethnicity, according to data from users who have purchased the MyHeritage DNA kit or uploaded DNA data to MyHeritage.
This new interactive feature is available for free to everyone, even if you’ve never taken a DNA test. Although not needed for this feature, if you’d like to take a DNA test, you can order the MyHeritage DNA test or upload DNA data from another company.
Overview
To navigate to the new feature, select “Ethnicities Map” from the DNA menu.
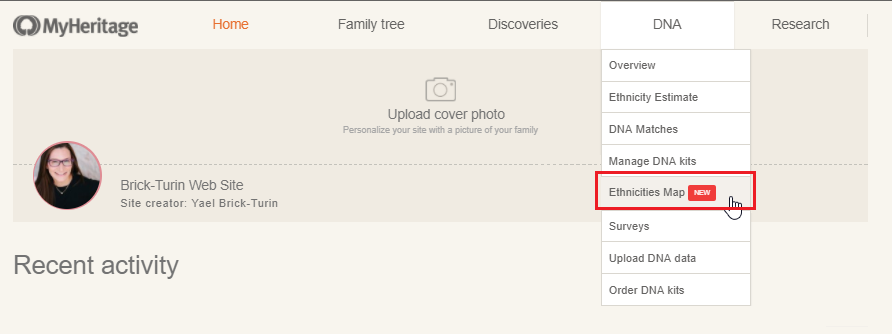
We couldn’t call this “Ethnicities around the world” in the menu because that’s too long! This will take you to the main page of the Ethnicities around the world feature.
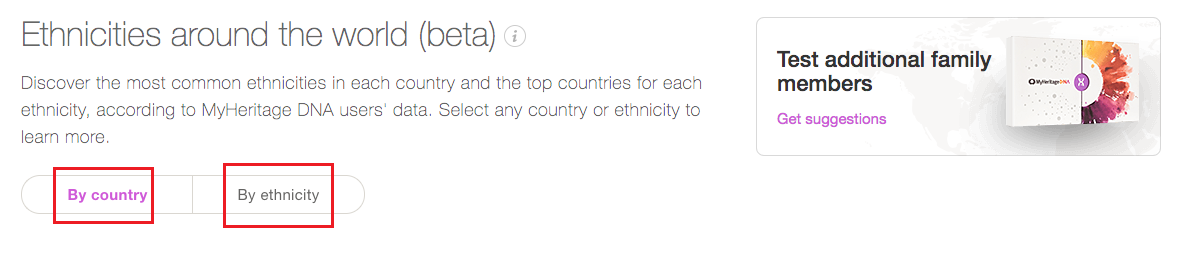
Select the “By country” tab to view the top ethnicities in a given country; or select the “By ethnicity” tab to view the top countries for a given ethnicity.
Top ethnicities in each country
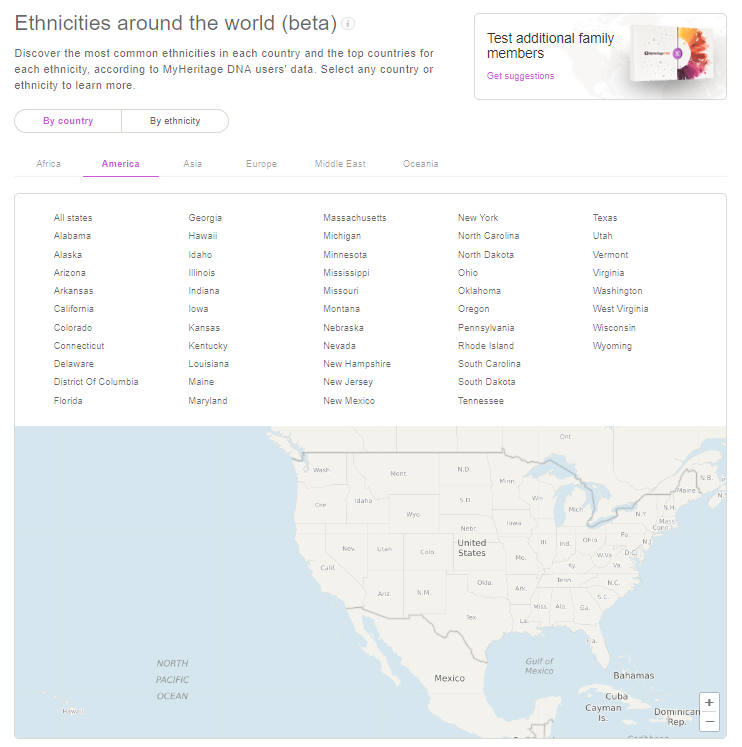
By selecting the “By country” tab, you can view the top ethnicities in each country. This information is currently available on more than 50 countries, and more countries will be added from time to time. Choose any country from the list, or select it on the map, to see the most common ethnicities there. The countries are arranged by continent, and if a country name is displayed in a dimmed gray, that means we don’t yet have enough data for it. Select countries listed in black.
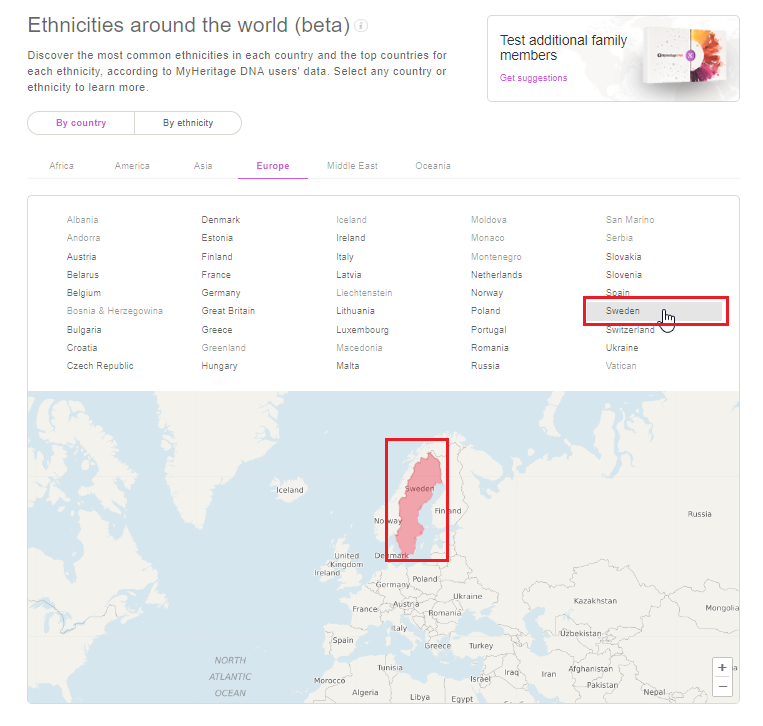
Select a country from the list or click it on the map to view its most common ethnicities
Select a country from the list or click it on the map to view its most common ethnicities
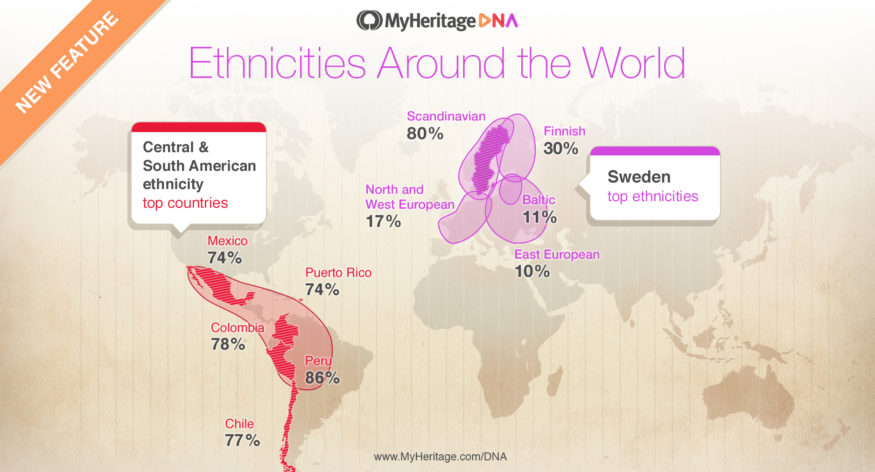
Once you choose a country, you’ll see a list of the most common ethnicities of DNA test takers who currently live in that country, based on aggregated data of MyHeritage users. It’s important to note that this is based on country of residence and not on country of birth from the family trees. For example, when you select “Sweden”, you’ll see that the top ethnicity is Scandinavian (80.1% of the test takers had at least 5% of that ethnicity), followed by Finnish at 29.9%. In countries with many immigrants the results can be surprising.
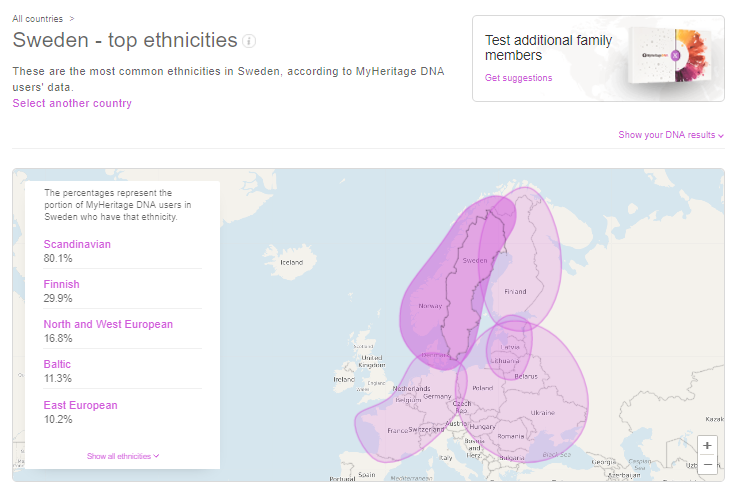
The top ethnicities in Sweden, shown in list format with percentages, and represented geographically on a world map
The top ethnicities in Sweden, shown in list format with percentages, and represented geographically on a world map
You’ll see up to the top 5 most common ethnicities in the country you select. To see a complete list, click on “Show all ethnicities”.
The percentages for the regions won’t add up to 100% because we aren’t showing how much Scandinavian each person in Sweden received in their DNA results; instead, you are seeing the percentage of MyHeritage DNA users in Sweden who have at least 5% Scandinavian in their Ethnicity Estimate.
To choose another country, navigate back to the complete country menu from the “All countries” link, or the “Select another country” link.
Top ethnicities in each state
For the United States, you can view top ethnicities by state. This map and list work the same way as the global map and list — simply select any state to see the most common ethnicities in that state.
Top countries for each ethnicity
You can also see where different ethnicities are most common. Navigate to the ethnicity view by clicking on the “By ethnicity” tab. Then, select an ethnicity from the list or the map.
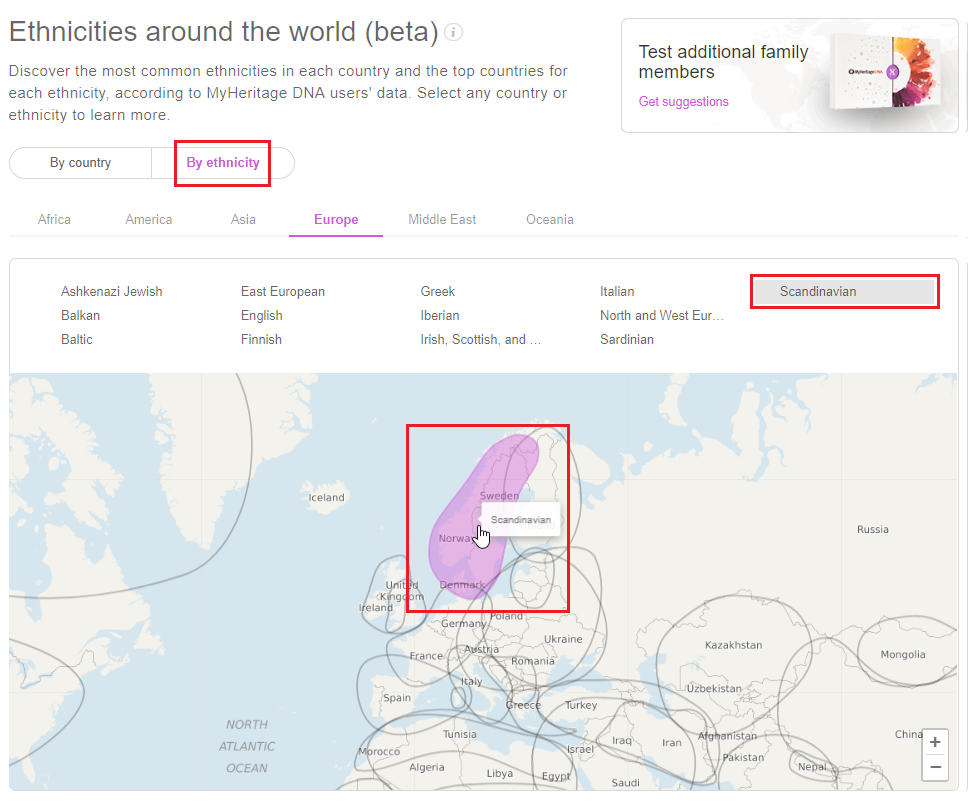
Select an ethnicity from the list or the map to learn which countries have the most people with that ethnicity
Select an ethnicity from the list or the map to learn which countries have the most people with that ethnicity
If you select “Scandinavian”, for example, you’ll see the countries where the greatest number of MyHeritage DNA users received Scandinavian results in their Ethnicity Estimates. Remember, these are countries of current residence, not birth. Up to the top 5 countries will be listed in the results box, in descending order, starting with the country where the highest percentage of people are part Scandinavian.
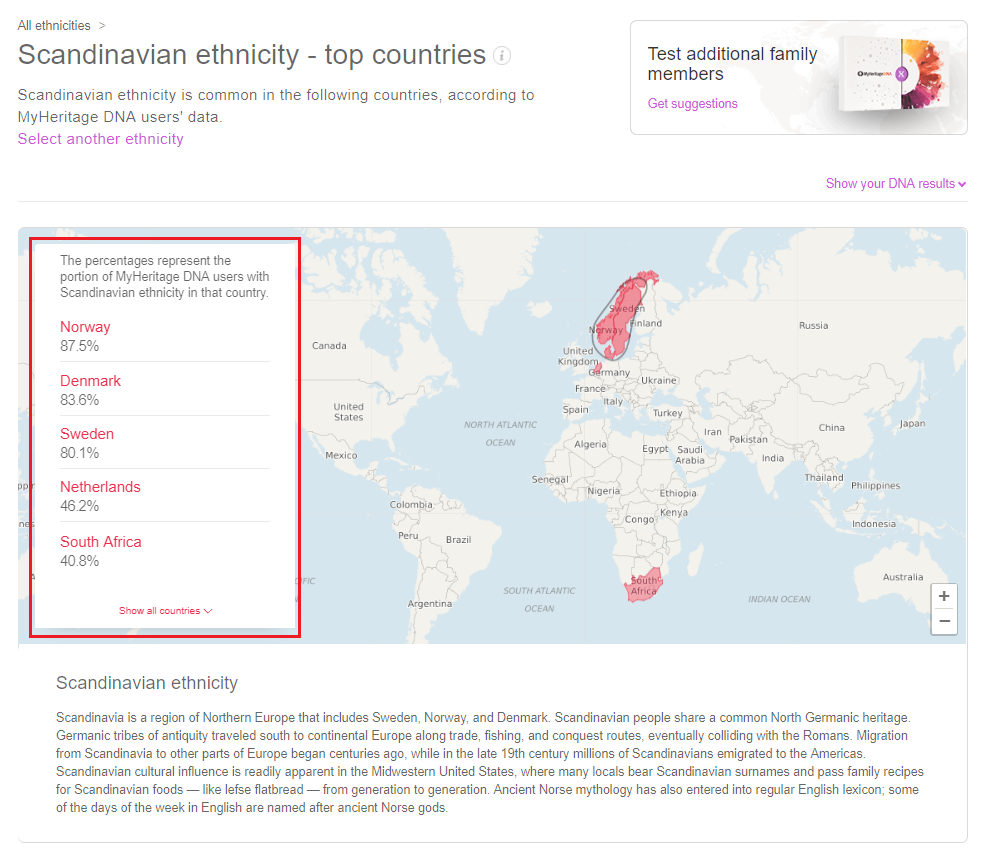
The top countries for Scandinavian ethnicity, shown in list format with percentages, and by geographic location on the map
The top countries for Scandinavian ethnicity, shown in list format with percentages, and by geographic location on the map
How do you compare?
The Ethnicities around the world feature is fun to explore and is open to anyone — you don’t have to have taken a DNA test, or even be logged in to MyHeritage, to satisfy your curiosity. You can select a country to view its top ethnicities, then immediately click one of the listed ethnicities to view its top countries, and so on.
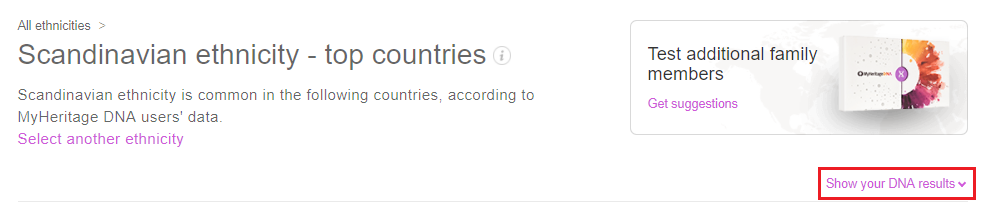
However, if you are logged in on a desktop or tablet device and have DNA data, you can compare your own ethnicity results to our huge DNA database. Click on the “Show your DNA results” link to see your Ethnicity Estimate.
Click on any of your ethnicities to explore in which countries or U.S. states your ethnicities are most common.
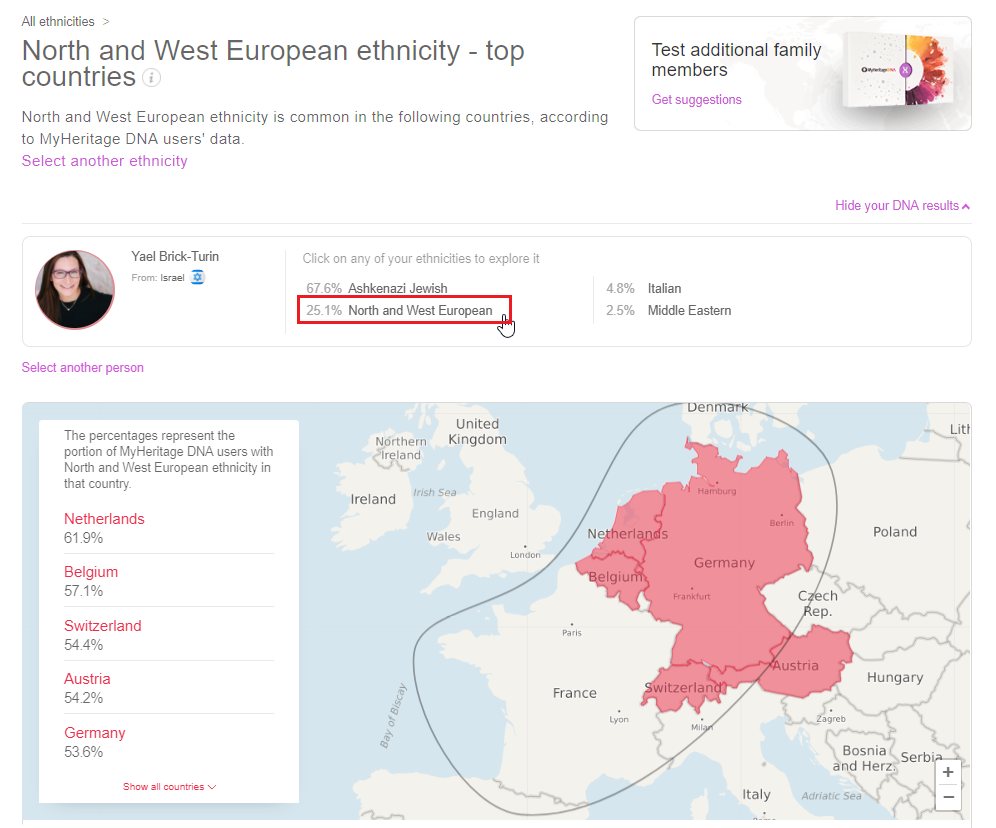
View your Ethnicity Estimate and click on any of your ethnicities to view their top countries
View your Ethnicity Estimate and click on any of your ethnicities to view their top countries
Note: France is not highlighted on the above map because DNA testing is not permitted in France so there are currently no MyHeritage DNA users residing there. Otherwise we’d expect France to be one of the top countries with the North and West European ethnicity.
After you see your own results, be sure to check out the MyHeritage Wiki to read more about ethnicities such as North and West European ethnicity, Iberian ethnicity, and North African ethnicity.
Summary
We’re excited to release the new and original feature, Ethnicities around the world, in beta. Anyone can now explore where ethnicities are most common, and the top ethnicities in various countries around the world. We hope you’ll have fun with this! This new feature will get better with time as we grow our DNA database, and as we improve the accuracy of our Ethnicity Estimates, which is planned for the next few months.
Enjoy!
The MyHeritage team
William L Webb
February 15, 2018
Great! Great!