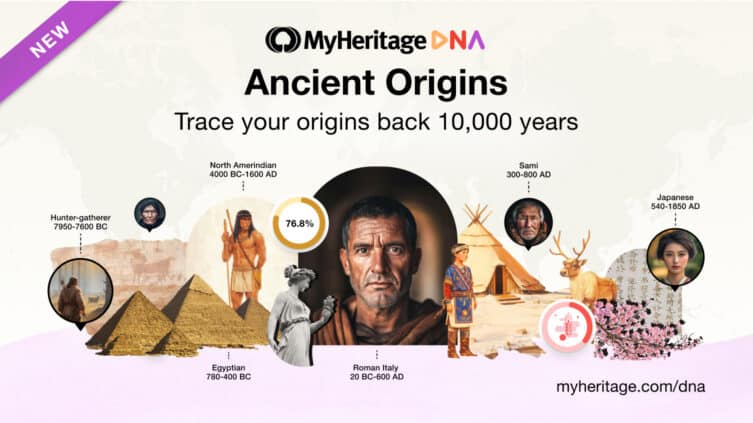
Ever wondered which ancient civilizations you descend from? Now you can find out! We’re thrilled to announce the release of Ancient Origins, a major new product that complements your MyHeritage DNA ethnicity reports. Ancient Origins enables you to trace your origins up to 10,000 years into the past and discover the ancient populations from which you descend, such as Imperial Romans, Norse Vikings, Phoenicians, and Ancient Egyptians.
Watch the beautiful video below to learn more about Ancient Origins:
Ancient Origins offers a comprehensive ancient DNA analysis and is a fascinating new addition to MyHeritage. It forms an important part of one’s wider family story, and is a must-have for lovers of history and archaeology, and anyone who is curious about their ancestral roots. The results are calculated based on your existing DNA results on MyHeritage, so there’s no need to take a new test. Ancient Origins is immediately available to all MyHeritage DNA customers and to all those who uploaded their DNA to MyHeritage from other DNA services. Ancient Origins is a premium feature on MyHeritage and requires a Complete or Omni subscription. It is available on desktop and mobile web, and support for it on the MyHeritage mobile app will be added very soon.
What is Ancient Origins?
The new Ancient Origins product is the result of a partnership between MyHeritage and Illustrative DNA, a startup company that is at the forefront of ancient ethnicity analysis. Ancient Origins complements MyHeritage DNA’s Ethnicity Estimate, which provides a percentage breakdown of an individual’s modern ethnic origins going back a few hundred years. Ancient Origins compares your DNA to ancient DNA samples uncovered in archeological excavations, and ancient populations from the Neolithic Period through the late Middle Ages.
Ancient Origins provides a set of detailed reports. They include a percentage breakdown of the ancient populations from which you descend in different historical eras; a breakdown of how much of your DNA traces back to populations of hunter-gatherers and early farmers; advanced reports that indicate one or more ancient populations that are closest to you genetically; and genetic distance maps visualizing your genetic proximity to ancient populations. A vast encyclopedia of ancient populations and ancient DNA samples is included for reference.
Ancient Origin reports are dynamic and will be updated periodically as more ancient DNA samples are added to the database, and as new scientific research papers are published with new findings on ancient DNA.
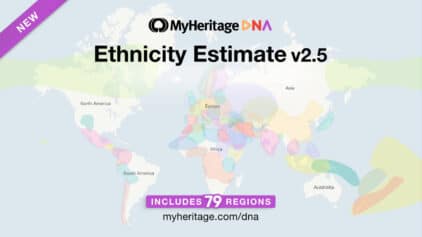
By the way, unrelated to Ancient Origins, the long-awaited update to the Ethnicity Estimate, v2.5, was released earlier this month. If you haven’t done so already, visit your DNA results on MyHeritage to view your Ethnicity Estimate v2.5 results. It’s also a great opportunity to check out your Ancient Origin results!
How it works
Ancient Origins is based on the latest developments in archaeogenetics, which is the study of ancient DNA. Advanced DNA extraction techniques that did not exist until recently enable scientists to analyze human samples excavated from archaeological sites around the world, date them, and extract DNA segments and genetic markers that are thousands of years old, or older. Using the location, time period, and additional archaeological evidence, researchers can associate samples with ancient civilizations. Many of these findings are published in scientific papers, and the samples are made publicly available.
The Ancient Origin reports are generated using Principal Component Analysis (PCA), which is an approach used to measure genetic distances using multi-dimensional vectors. Subject to your consent, Ancient Origins first processes your raw DNA data to create a vector known as DeepAncestry Coordinates. DeepAncestry is a 25-dimensional vector derived by comparing your DNA data to a reference set of modern and ancient populations. The DeepAncestry Coordinates are then used anonymously to generate the Ancient Origin reports.
The results are presented in comprehensive reports that are both informative and visually appealing. These include ancient populations that are now extinct or that have merged into other populations over time, such as Canaanites, Scythians, Visigoths, Etruscans, and many others. The Yellow River civilization, Ancient Egyptians, Ancient Greeks, Insular Celts, Ancient Bantus, Central Amerindians and Ashkenazi Jews of the Middle Ages are among the many ancient populations represented in the Ancient Origins product.
Accessing Ancient Origins
To access Ancient Origins, log in to your MyHeritage account on the web and select “Ancient Origins” from the DNA menu.
Accessing Ancient Origins (click to zoom)
Users with a MyHeritage Complete or Omni subscription are eligible to receive the reports at no additional cost. If you don’t have one of these plans, you’ll be offered to upgrade your account to receive the reports. If you already have a Complete or Omni subscription, or once your account is upgraded, you’ll have the option to generate the Ancient Origin reports by clicking on “Get your Ancient Origin reports”.
Ancient Origins main page on MyHeritage (click to zoom)
Before the reports can be generated, you’ll need to consent to the processing of your DNA data to provide you with the Ancient Origin reports.
Once you give your consent, you’ll be asked to select an origin that best represents you. The algorithm behind the Ancient Origins Breakdown report is based on thousands of ancient DNA samples with known origins. Your input helps the algorithm focus on the most relevant reference samples and ancient populations. You can only select one such origin at a time. If you have one dominant ethnicity, select that ethnicity. If you don’t have one dominant origin, or if you are unsure what to choose, select “Global”.
Select an origin (click to zoom)
The reports will be ready within 24 hours, but are usually ready sooner. You’ll receive an email as soon as they’re ready.
When the reports are ready and you return to the Ancient Origins tab, you’ll see an overview of the different reports. Use the menu on the left-hand side of the page to view any of the reports.
Results are ready! Overview of Ancient Origin reports (click to zoom)
Below, we describe the reports one by one.
Ancient Origins Breakdown
Everyone has a genetic story that goes back thousands of years, and the Ancient Origins Breakdown is the first step to exploring that story.
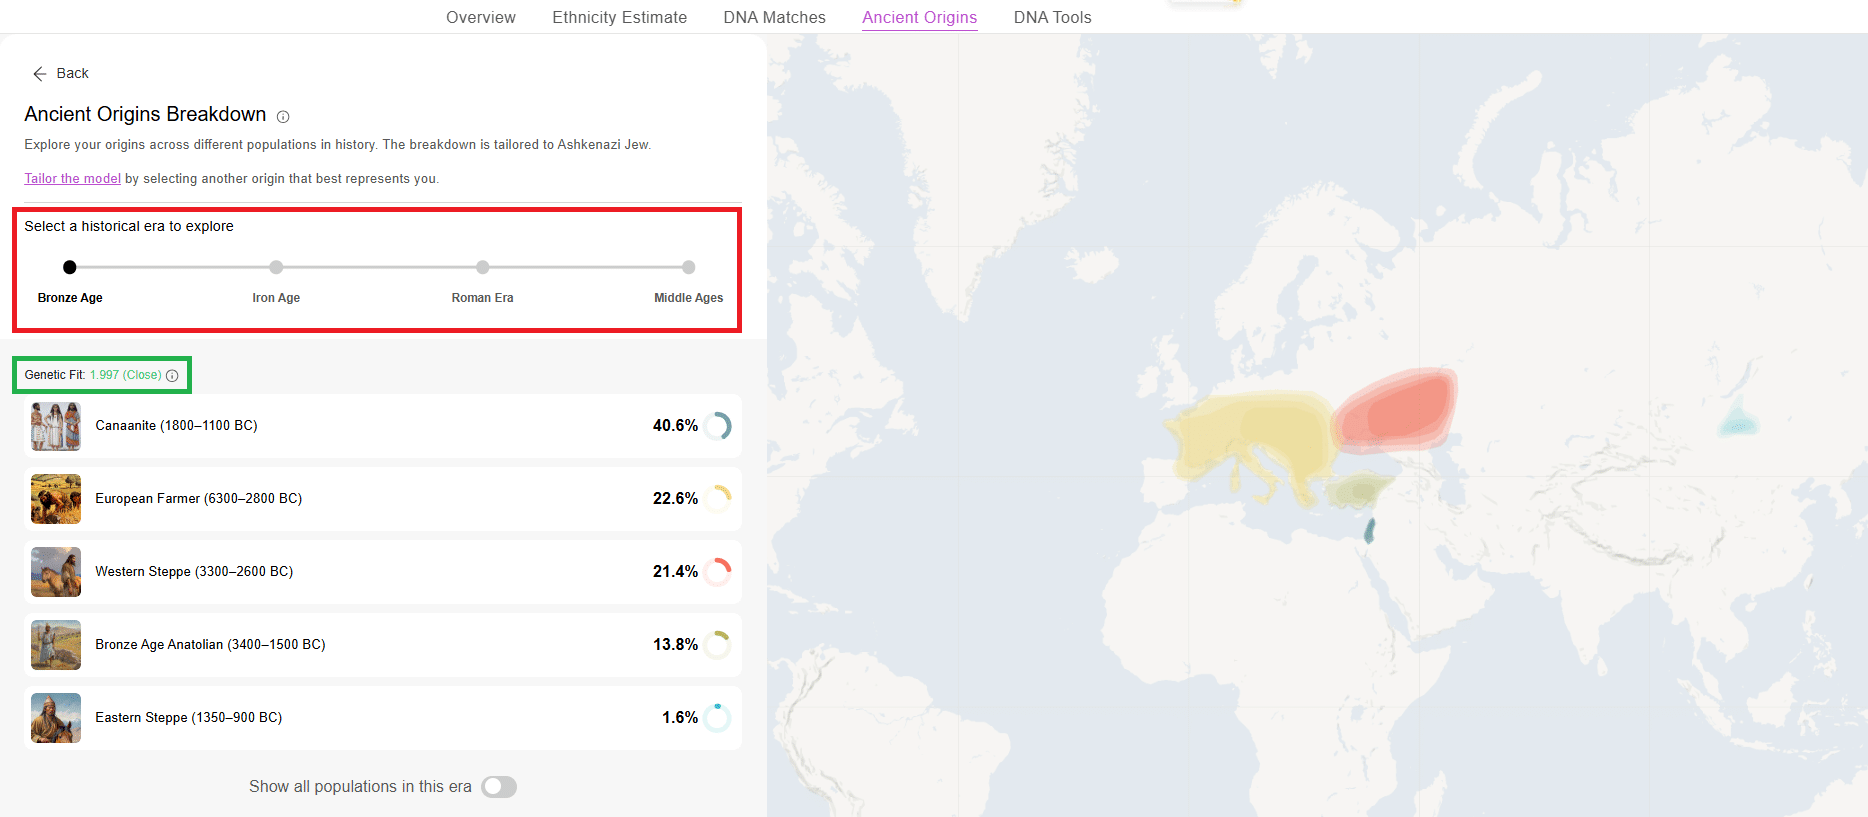
This report shows a percentage breakdown of the ancient populations from which you descend. The report includes a map that shows the geographical location of each ancient population. You can explore how your origins evolved across four historical eras: Bronze Age, Iron Age, Roman Era, and the Middle Ages. Use the slider (marked below in red) to explore the results by era. To show all populations in this era, use the toggle button at the bottom of the screen.
Ancient Origins Breakdown, with a slider to explore different eras (click to zoom)
The results are influenced by the origin you selected before the results were generated. You can click “Tailor the model” to change the selection to another region that may better represent your origins.
A Genetic Fit score appears above the percentage breakdown (marked above in green). This score indicates how closely your DNA matches the ancient populations listed. A lower score means a closer match to the reference populations. As you review the results by historical era, the Genetic Fit score will be updated accordingly.
Genetic Fit score explained (click to zoom)
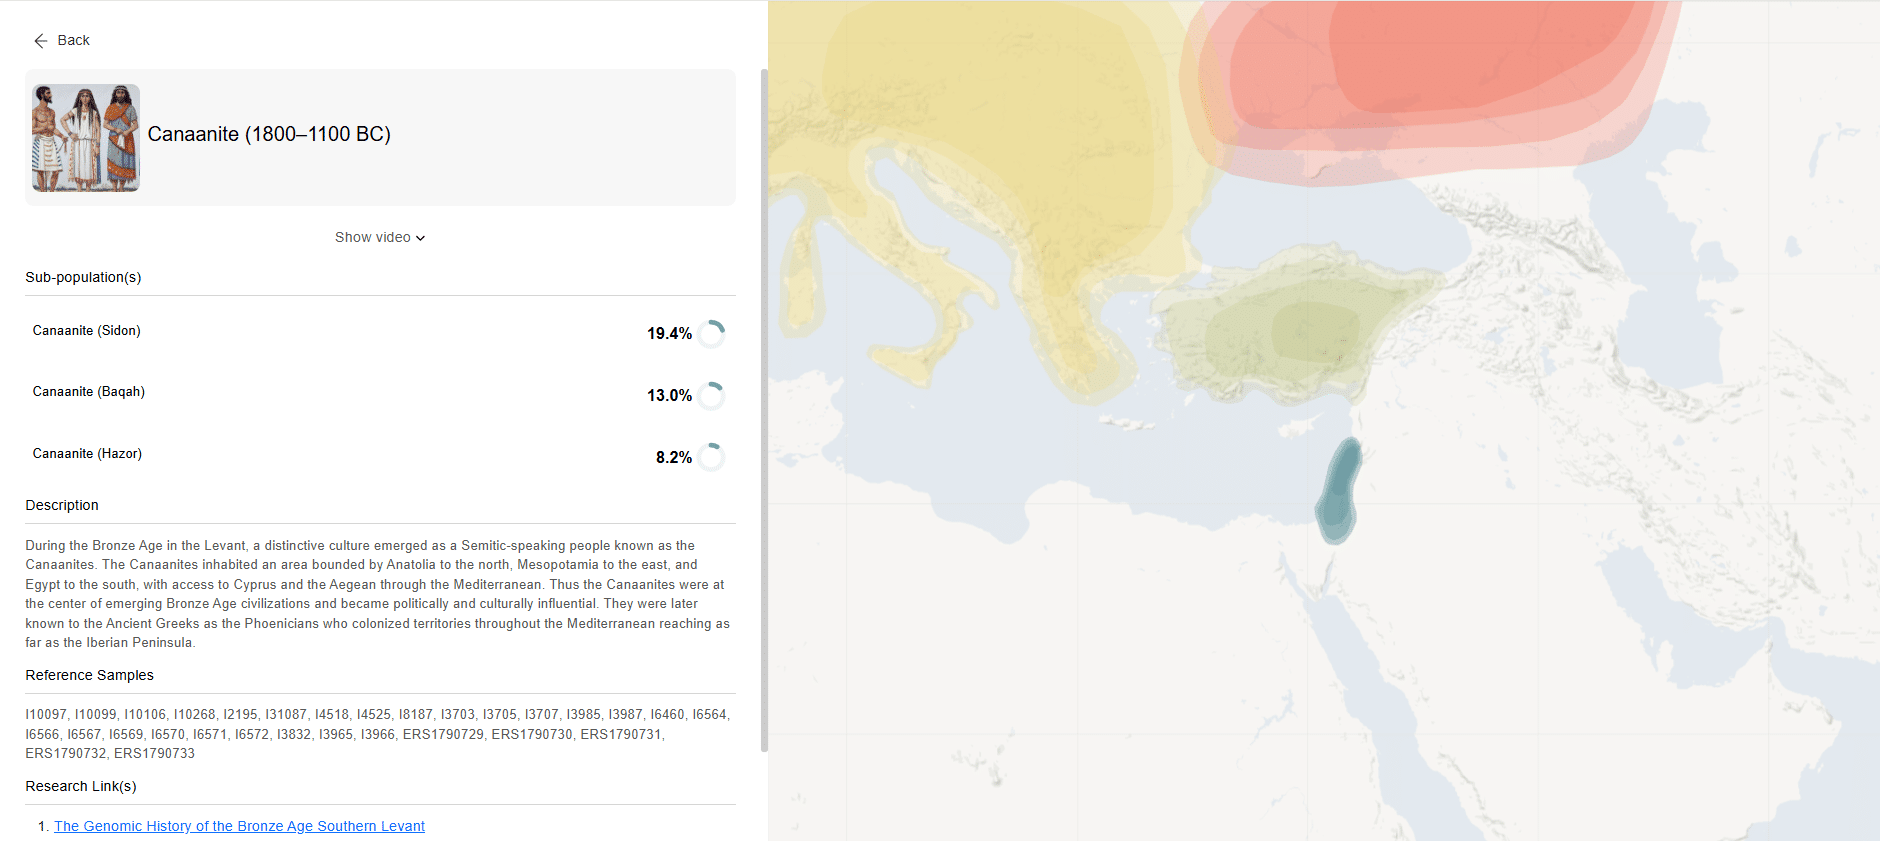
Click any population on the left panel or on the map to learn more about it. A panel will be displayed, providing more details including sub-populations, a description of the population, reference samples from the research, and links to scientific articles about the archaeological findings.
Ancient Origins Breakdown: population description and research references (click to zoom)
Many of the ancient population descriptions also include a unique innovation added by MyHeritage: AI avatars that represent the population. The AI avatars leverage MyHeritage’s expertise in generative AI to tell the story of their civilization in animated videos that are fun and engaging, to foster a deeper appreciation of each group’s rich cultural heritage. Here are two examples:
Hunter-Gatherer and Farmer Breakdown
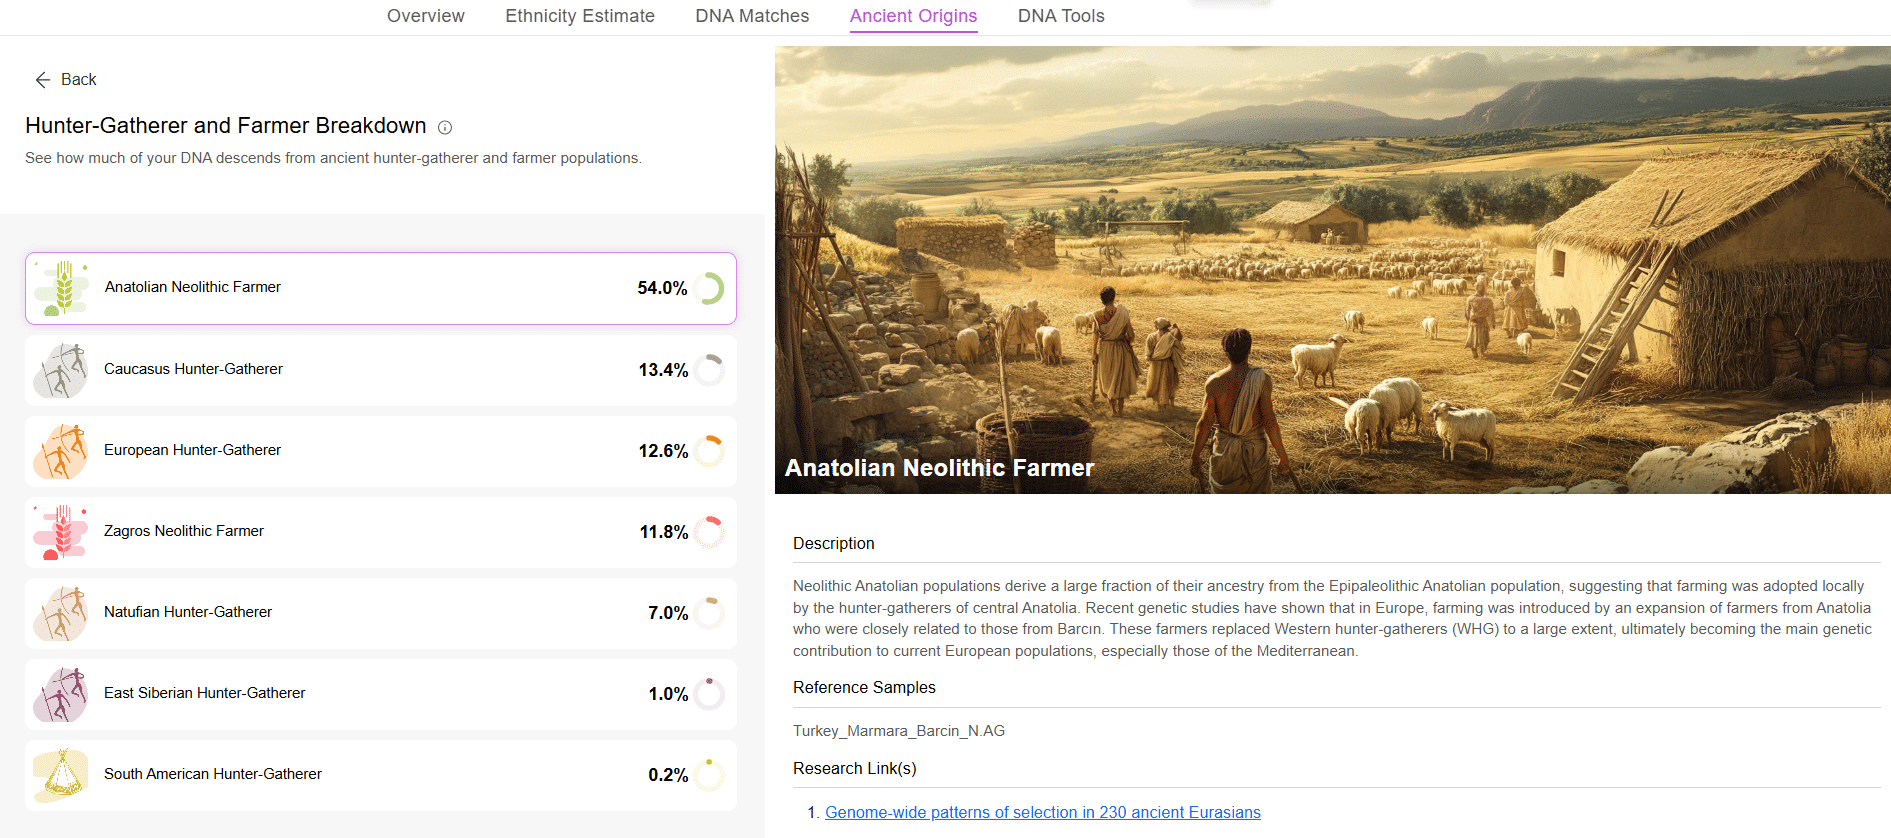
The Hunter-Gatherer and Farmer Breakdown indicates what percentage of your DNA traces back to early hunter-gatherer and farmer populations. As ancient populations transitioned from hunting and gathering to farming, distinct genetic and cultural lineages emerged. As a result, many people today carry traces of both hunter-gatherer and early farmer DNA.
Hunter-Gatherer and Farmer Breakdown (click to zoom)
Genetic Similarities Breakdown
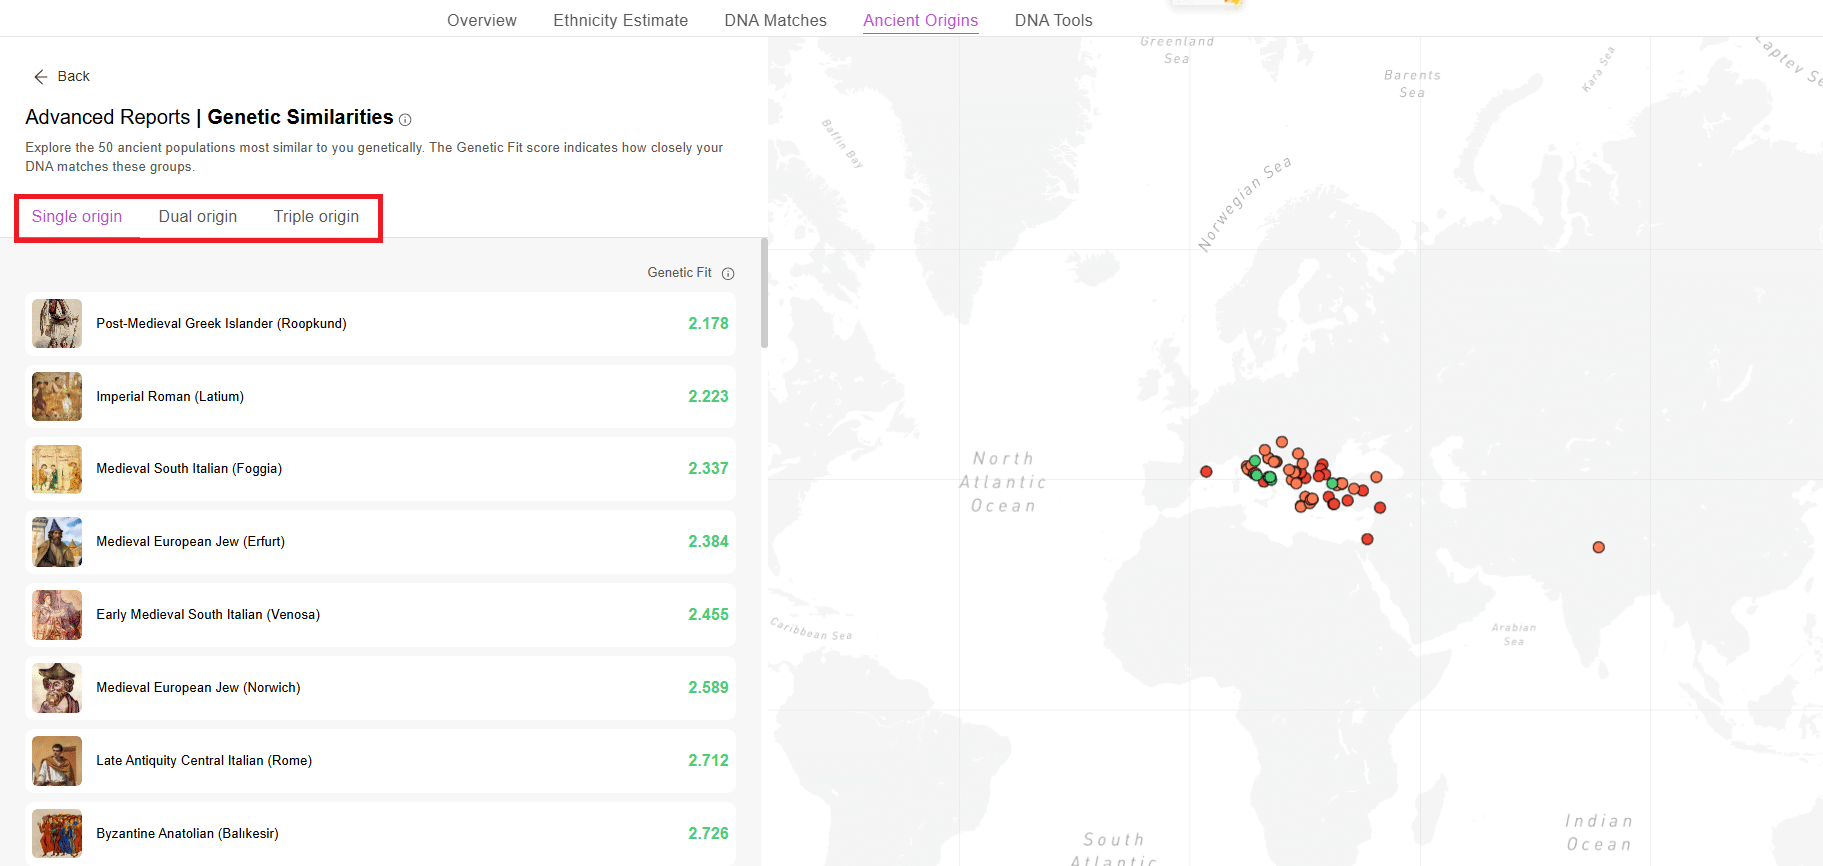
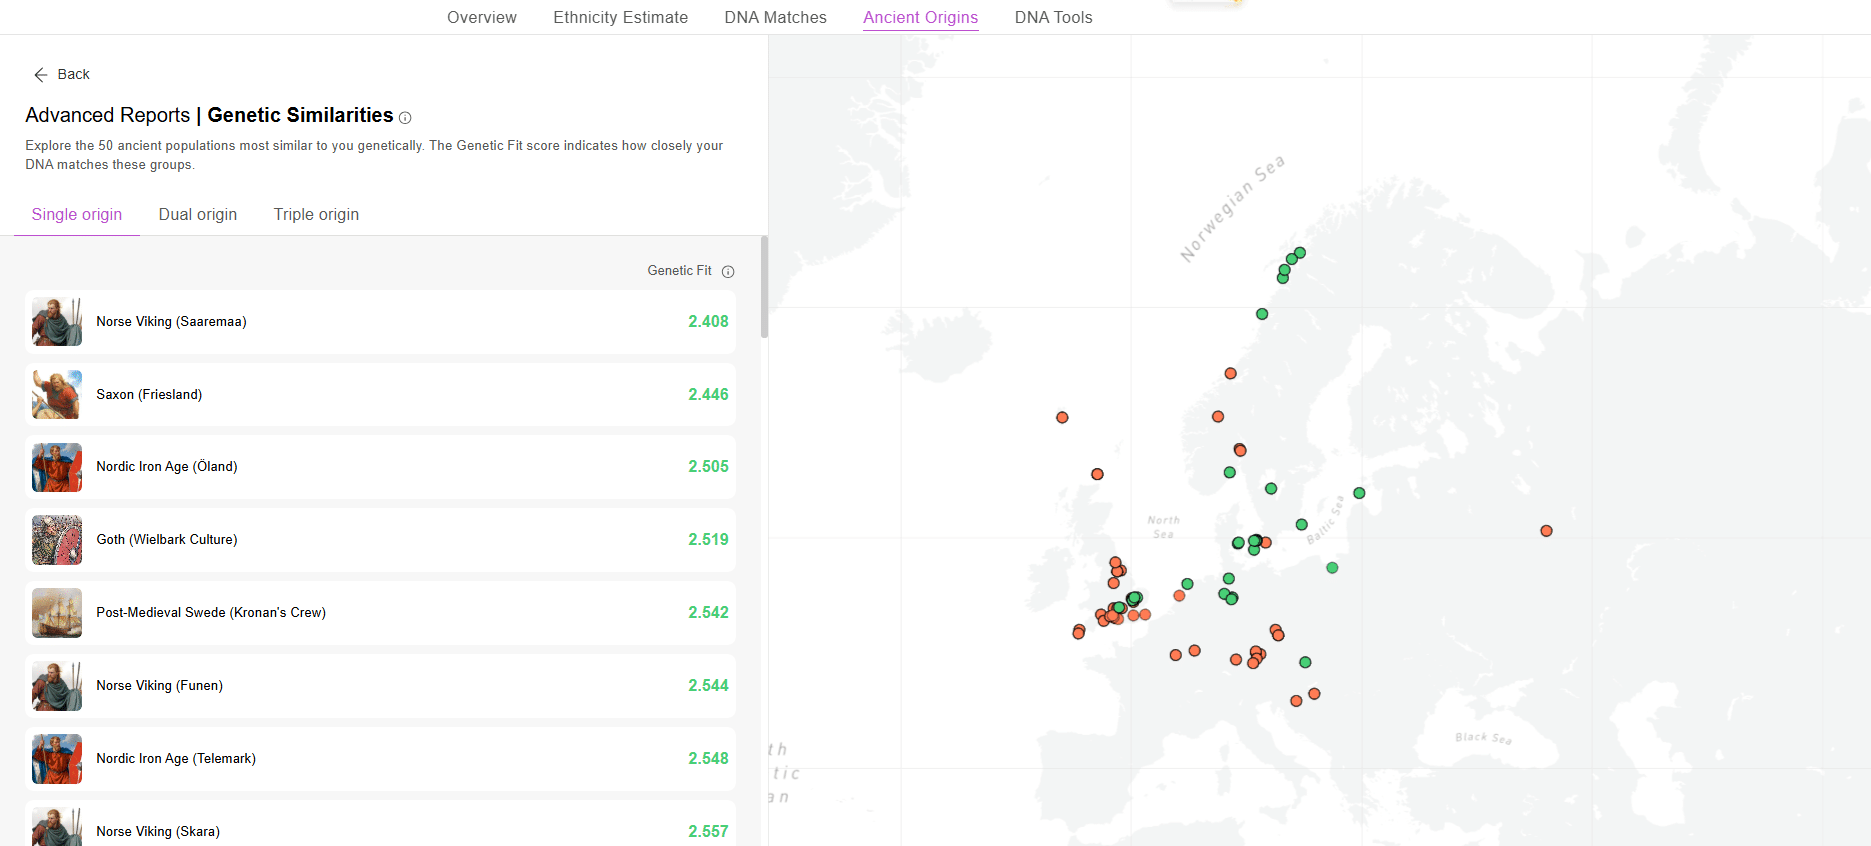
The Genetic Similarities Breakdown is an advanced report that enables you to better understand how closely your DNA compares to ancient populations through three different views: single origin, dual origin, and triple origin. Unlike the Ancient Origins Breakdown, which provides a report based on a tailored model of your choosing, the Genetic Similarities report compares your DNA to all of the reference populations in the database. The report shows the top 50 ancient populations, or population combinations, that are most similar to you genetically. Use the tabs to toggle between the different views (marked below in red).
Genetic Similarities: Single origin (click to zoom)
Click a population name to learn more about it. In addition to a description of the group, a table appears showing the genetic distance between this group and various modern populations. In the example below, the table shows that Imperial Roman (Latium) is genetically similar to several Italian and Greek populations, as well as to Ashkenazi Jews.
Genetic Similarities: genetic proximity to modern populations
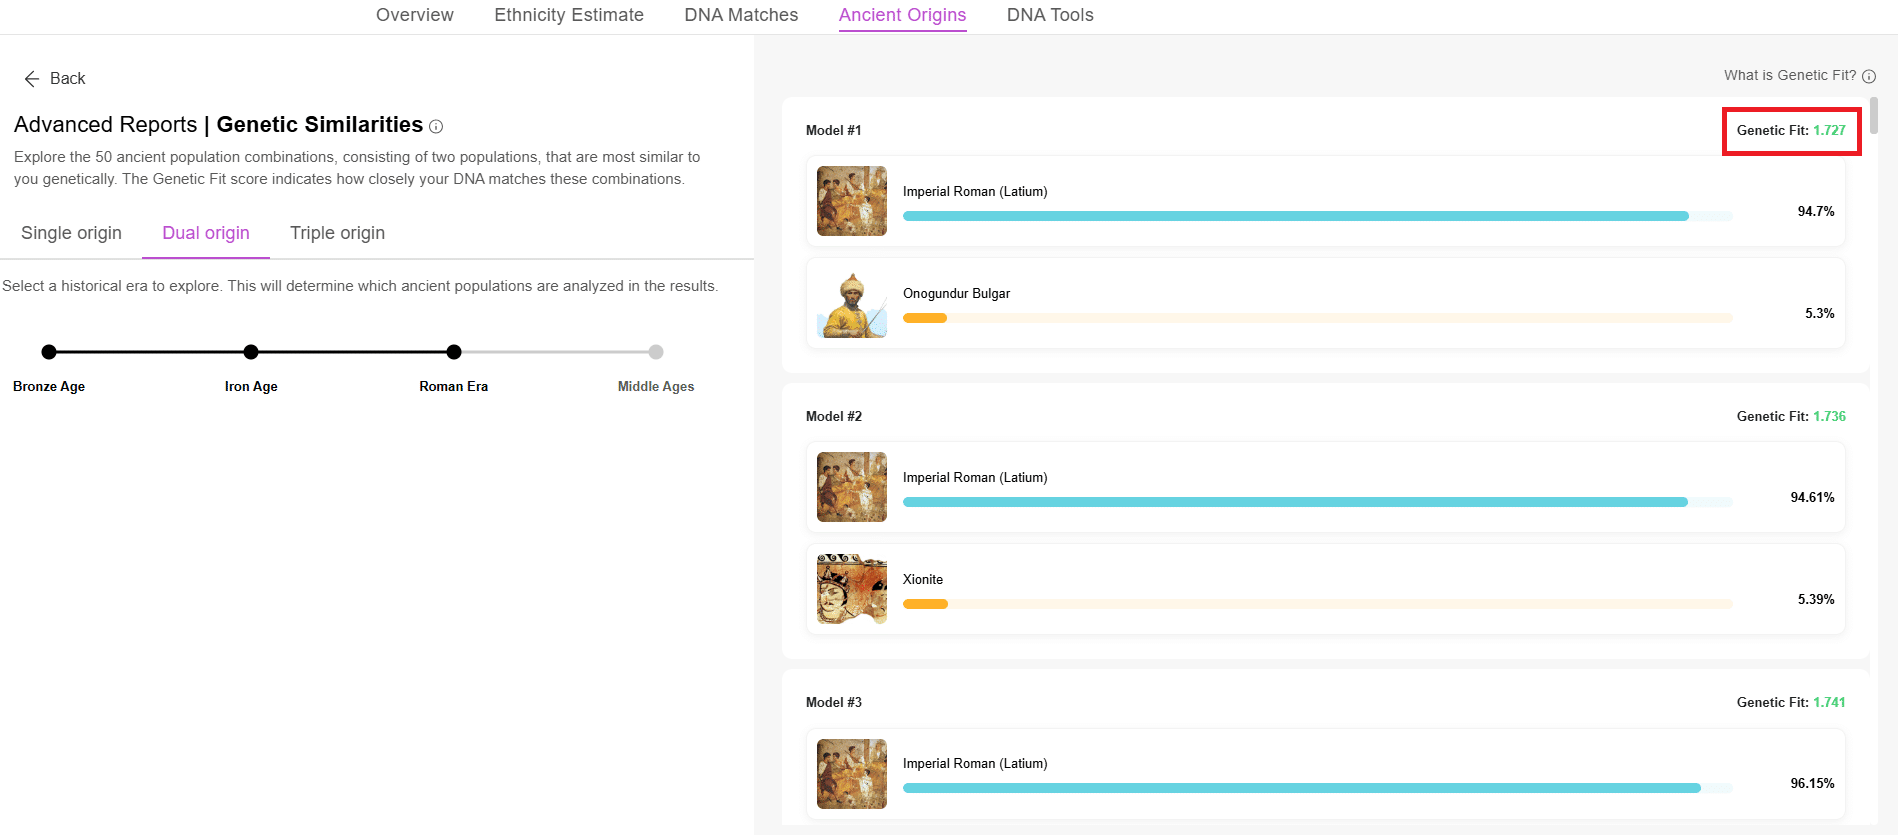
Dual origin reports show the ancient population combinations consisting of two populations that are most similar to you genetically. This view includes the same historical eras slider that appears in the Ancient Origins Breakdown. The Genetic Fit score of each model is displayed, as marked below in red.
Genetic Similarities: Dual origin report (click to zoom)
An individual’s genetic composition can be calculated in multiple ways based on different reference populations. This report displays the top 50 models with the best Genetic Fit. The models that have the best Genetic Fit (i.e., that return populations that are the most similar to you genetically) are listed first.
Triple origin reports are very similar to the dual origin reports, but show models consisting of three ancient populations:
Genetic Similarities: Triple origin reports (click to zoom)
Genetic Distance Maps
Genetic distance maps visualize your genetic proximity to different ancient populations. They are based on Principal Component Analysis (PCA), which is a statistical method used to measure genetic distances.
Each point on the plot represents a different ancient population or ancient sample, and they are clustered because of the genetic similarities between them. This view is fascinating because it not only shows which populations are closest to you genetically, but it also shows which populations are close to each other, and which ones are outliers. You will find that there is a lot of similarity between this and geography, because populations that lived next to each other often had cultural interactions and intermarried throughout history.
You are represented with the label “You” in black. Your label will be positioned close to the populations that you resemble the most. Use the dropdown selector to focus on specific regions that are relevant to your origins. For example, if you have European origins, select “Europe” for higher-resolution analysis. To visualize how similar your DNA is relative to all samples and populations in the reference panel, select “Global” as the region.
If you prefer to view population clusters rather than individual points on the plot, click the toggle button, marked below in green.
Genetic distance maps (click to zoom)
Simplified genetic distance maps with clusters (click to zoom)
To download any of the maps, click the camera icon at the top right.
Downloading the genetic distance maps
Using the toolbar you can also zoom in or out, pan across the map, and access other useful tools to analyze the map in greater detail.
Sample Database
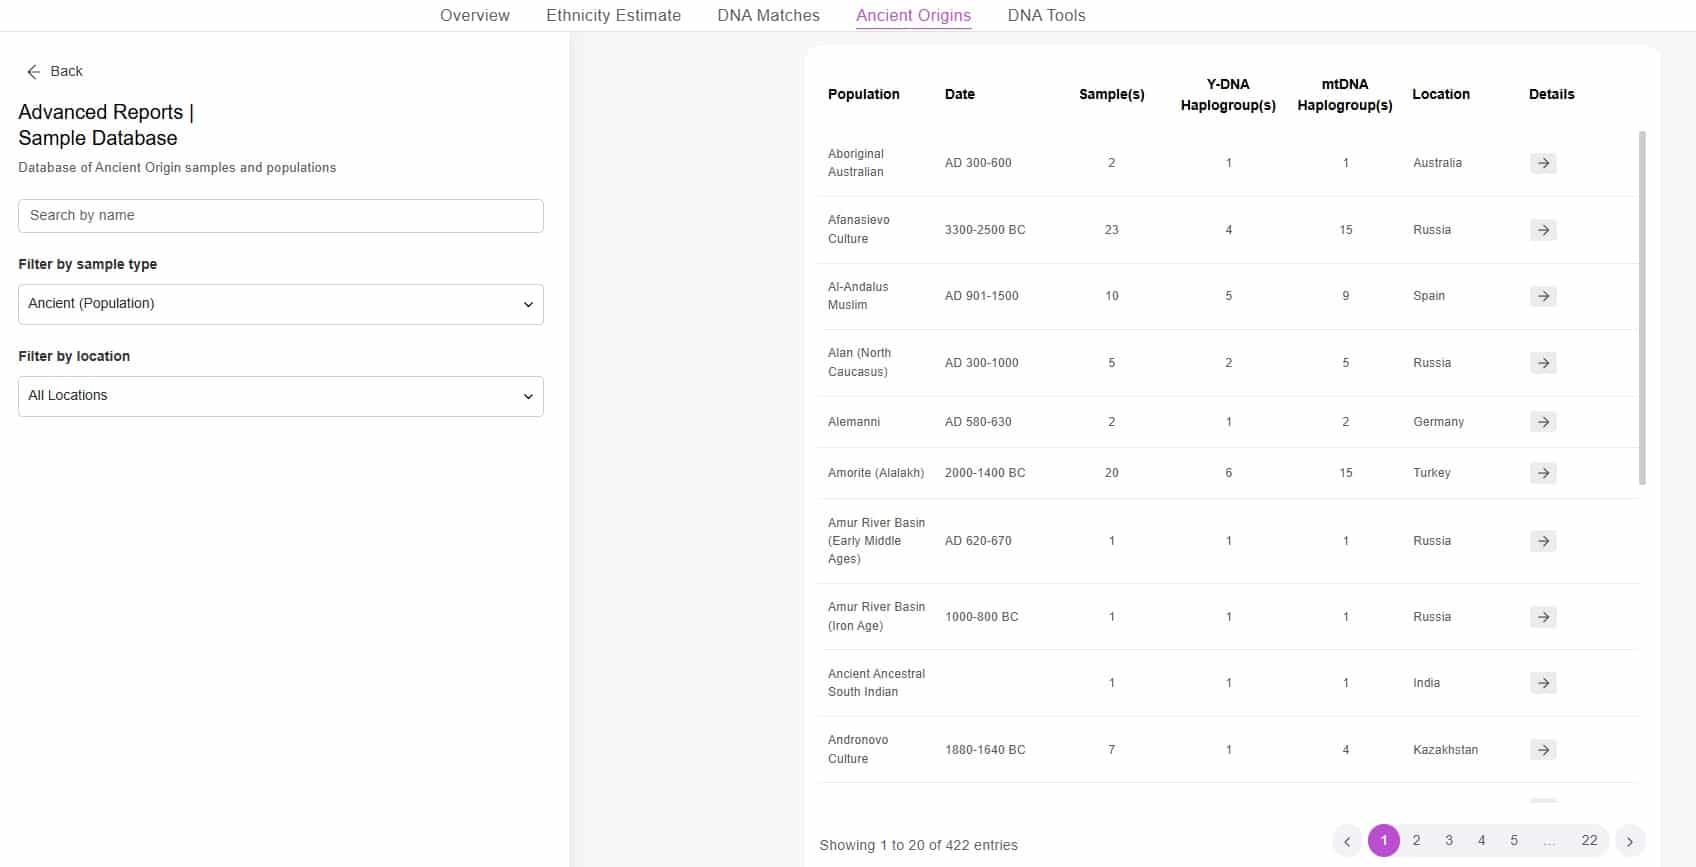
For those who are interested in diving deeper into the research behind Ancient Origins, a reference encyclopedia is provided with the list of ancient DNA samples and populations used to develop the reports. It is very comprehensive and also includes populations and samples not yet represented in the reports. You can filter the database by sample type or location, and learn more about the origin of each population: when they lived, how many samples were collected, Y-DNA and mtDNA haplogroups, and the location where the samples were found. You can also click the arrow in the “Details” column for more details about the population.
Ancient Origins sample database (click to zoom)
Your reports will be updated periodically as new research emerges and new samples are added to the database.
Ancient Origins: Examples
User 1
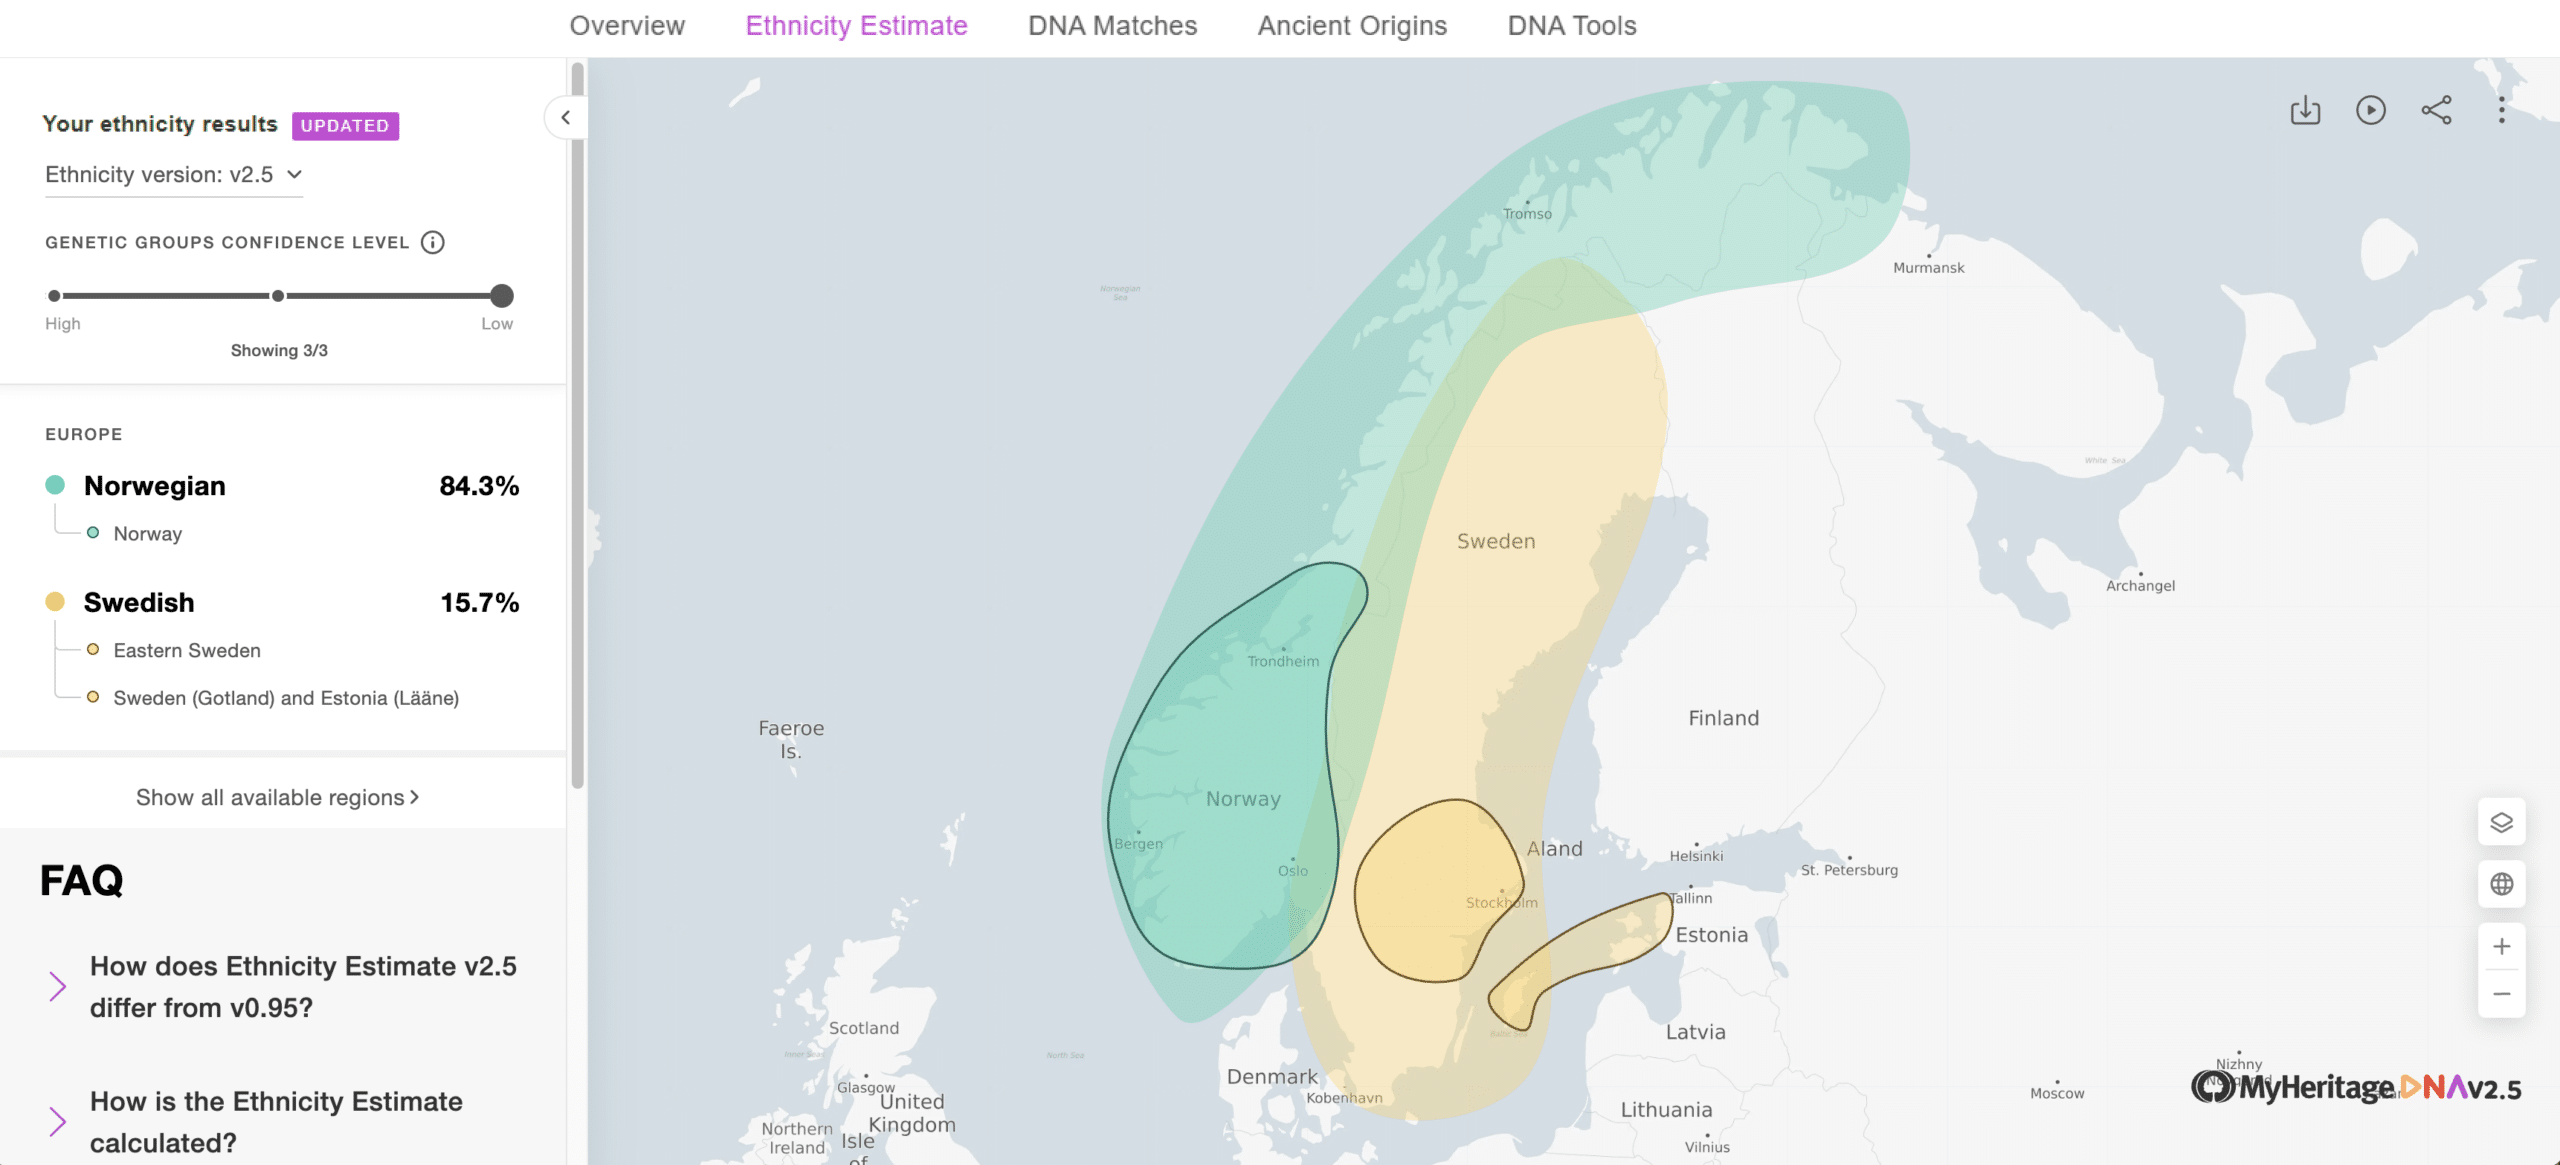
This user’s modern Ethnicity Estimate on MyHeritage shows that he has strong Scandinavian roots: he is 84.3% Norwegian and 15.7% Swedish, with several Genetic Groups in Scandinavia.
Ethnicity Estimate: Norwegian and Swedish origins (click to zoom)
The same user’s Ancient Origin results include a Genetic Similarities report indicating that among all the ancient populations, his DNA is most similar genetically to Norse Vikings from Saaremaa. The Genetic Fit of 2.408 suggests a close match to the reference populations.
Genetic Similarities: Norse Viking (click to zoom)
User 2
The user in the example below is Ashkenazi Jewish, with the largest percentage of her ethnicity coming from Poland, Hungary, Romania, and Czechia, and smaller percentages from Germany, France, Netherlands, and the USSR.
Ethnicity Estimate: Ashkenazi Jewish origins (click to zoom)
The same user’s Ancient Origins Breakdown shows 40.6% Canaanite origins during the Bronze Age, showing that historically, many of her ancestors originated in the biblical land of Israel, which is consistent with Jewish history.
Ancient Origins Breakdown: Canaanite origins during the Bronze Age (click to zoom)
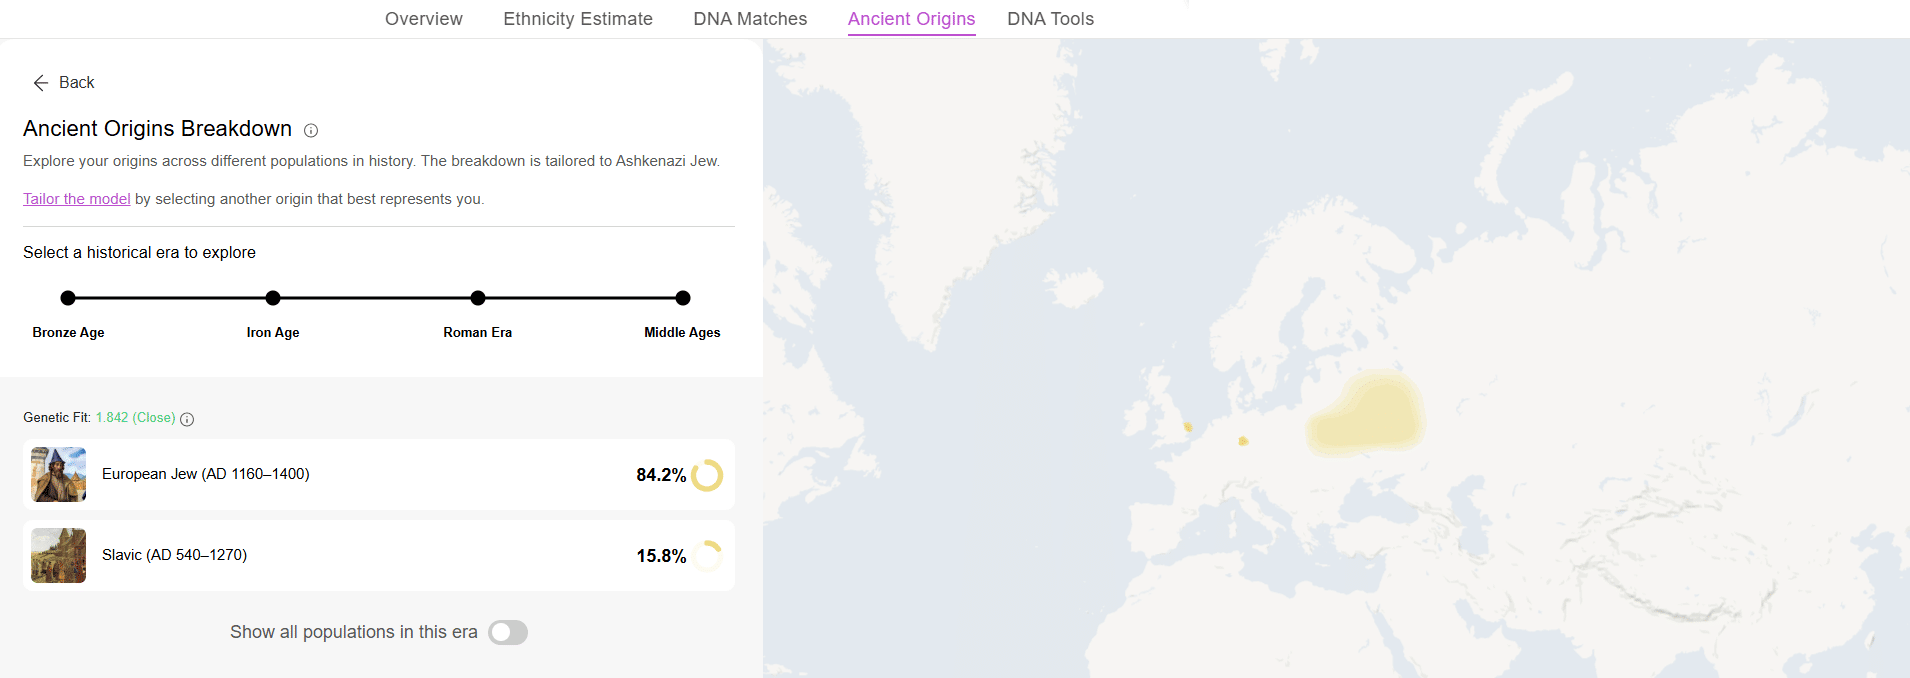
When the slider is moved to show the breakdown during the Middle Ages, the same user’s results indicate 84.2% European Jewish origins (based on archaeological excavations of old Jewish cemeteries in Europe) and 15.8% Slavic origins, with an even closer Genetic Fit of 1.842.
Ancient Origins Breakdown: European Jewish origins during the Middle Ages (click to zoom)
User 3
The user in the example below has Chinese roots.
Ethnicity Estimate showing Chinese origins (click to zoom)
The Ancient Origins Breakdown shows that when compared to all populations from the Bronze Age, his DNA closely matches the Yellow River civilization (77.6%), with smaller percentages of Southeast Asian and Liao River origins.
Ancient Origins Breakdown: Yellow River origins during the Bronze Age (click to zoom)
Fast forward a few centuries and the same user’s results from the Middle Ages indicate 79.4% Sinitic origins, with a Genetic Fit of 1.228, which indicates a close match with the reference populations.
Ancient Origins Breakdown: Sinitic origins during the Middle Ages (click to zoom)
User 4
The example below shows results received by a user who lives in Albania. This user’s MyHeritage Ethnicity Estimate shows 75.2% Greek and Albanian ethnicity, and 24.8% Balkan ethnicity. Several Genetic Groups reveal the modern Albanian roots of this user.
Ethnicity Estimate showing Albanian origins (click to zoom)
The same user’s Ancient Origins Breakdown during the Roman Era shows 76.8% Roman Illyria origins and 20.8% Roman Pannonia origins, with a strong Genetic Fit of 2.145.
Ancient Origins Breakdown: Roman Illyria and Roman Pannonia origins (click to zoom)
This fits perfectly with the belief of most modern scholars, that modern-day Albanians are the descendants of the Illyrians.
User 5
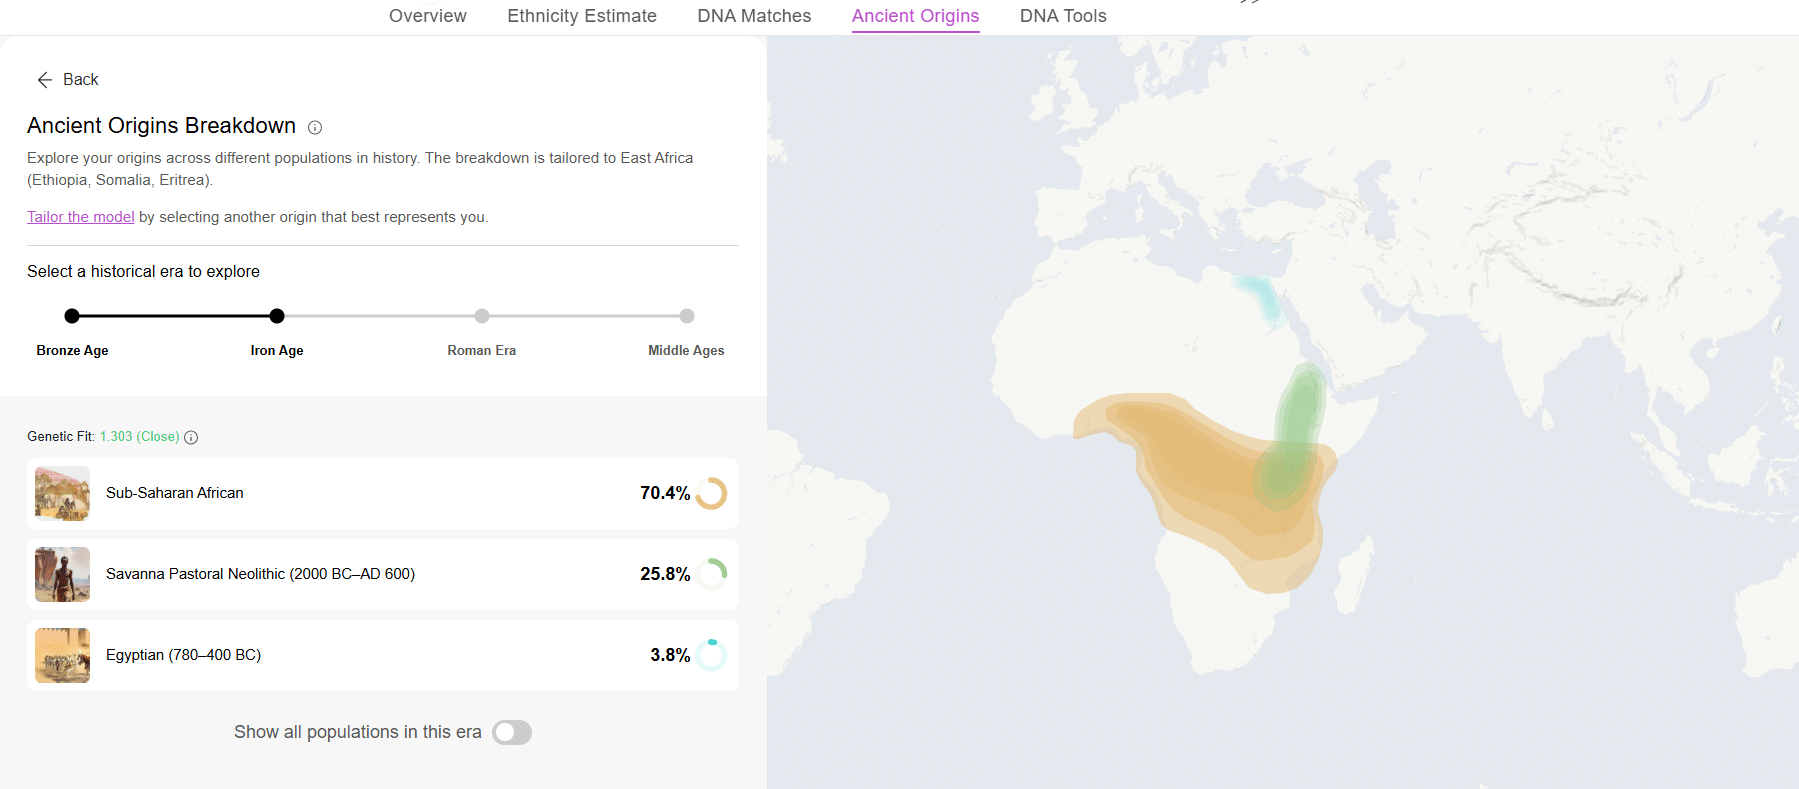
The user in the following example is 97.8% East African and 2.2% Ethiopian and Eritrean according to her MyHeritage Ethnicity Estimate.
Ethnicity Estimate showing East African origins (click to zoom)
This user’s Ancient Origins Breakdown during the Iron Age shows 70.4% Sub-Saharan African origins, and 25.8% Savanna Pastoral Neolithic origins. The Genetic Fit score of 1.303 shows a very close match with the reference populations.
Ancient Origins Breakdown: Sub-Saharan African and Savanna Pastoral Neolithic origins (click to zoom)
In the development of the Ancient Origins product, careful efforts were invested to protect the privacy of MyHeritage users. Ancient Origins is an opt-in feature on MyHeritage, and explicit consent is required before results can be generated. Ancient Origins is based on MyHeritage’s partnership with Illustrative DNA. At no time is your raw genetic data transferred to them. The only information that is passed on to Illustrative DNA is an anonymous vector called DeepAncestry Coordinates, which is immediately deleted by Illustrative DNA at the end of each session.
If you have opted in but later wish to opt out and delete your Ancient Origin reports, you can do so by selecting “Manage DNA kits” from the DNA menu. Then, click the three-dot menu next to the DNA kit, and select “Delete Ancient Origin reports”.
Cost
Ancient Origins is a premium feature on MyHeritage. A Complete or Omni subscription is required to receive the reports, which include periodic updates as new research emerges and new samples are added to the database. If you manage multiple DNA kits on MyHeritage, a Complete or Omni plan will give you access to Ancient Origins for all DNA kits that you manage. Many users are already eligible to receive the Ancient Origin reports at no extra cost thanks to their existing subscription. Other users can upgrade to unlock Ancient Origins and many other valuable features for family history research and genetic genealogy. Learn more about MyHeritage’s subscription plans.
Summary
Ancient Origins is an exciting new product that takes your MyHeritage DNA results further back in time to reveal the ancient populations that shaped who you are. This fascinating new feature forms the third pillar of MyHeritage’s DNA analysis, together with the DNA Matches and Ethnicity Estimate, and enables you to explore how your heritage evolved over thousands of years. We invite you to discover your Ancient Origins today and gain new insights about your origins. Enjoy!
Fantastic! Confirmed all my research. Great stuff myheritage
LD
Lloyd de Vere Hunt
February 24, 2025
Much affirming data
Four takeaways –
1) our Levantine Haplogroup adds Spain, a migrational point that will be useful to all of us under J-70 (over 1000 members)
2) Baltic found suggesting early marriages occurred between the Germans who moved there with the Livonians
3) Sareema (the 4th Baltic Kingdom with Latvia, Lithuania and Estonia found in large proportion. We know of relatives who have been there.
4) the Sami is very interesting, my one question would be how common a finding this is across the customer base given the very tiny remnant of population left today
Thanks for the “third pillar” being delivered as promised before RootsTech!!
The fact that that you note that this can be updated as new digs are catalogued just makes it even more exciting.


Teresa
February 21, 2025
Fantastic! Confirmed all my research. Great stuff myheritage