Introducing cM Explainer™ to Predict Relationships Between DNA Matches With Greater Accuracy
One of the most important benefits of taking a DNA test is the matches that you receive. DNA Matches reveal many relatives you never knew about before, based on shared DNA inherited from common ancestors. However, the relationships to your DNA Matches can be confusing. This results in many users not understanding how they are related to most of their DNA Matches, which holds them back from using the matches to advance their family history research and make new discoveries.
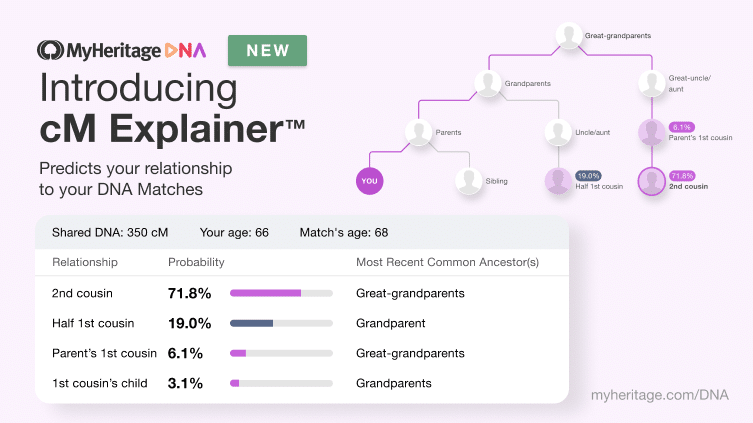
Today we’re excited to announce the release of cM Explainer™, an innovative, free new feature on MyHeritage that estimates familial relationships between DNA Matches with high accuracy. This helps overcome the challenge of understanding relationships to DNA Matches. For every DNA Match, cM Explainer™ predicts the possible relationships between the two people and the respective probabilities of each relationship, estimates who their most recent common ancestor(s) could be, and displays a diagram showing their relationship path.
DNA Matches are characterized by the amount of DNA shared between two individuals, measured using a unit of genetic distance called centimorgans (cM). cM Explainer™ is unique in the way it uses both the centimorgan value as well as the ages of the two individuals (if known) to fine-tune its predictions, making MyHeritage the only major genealogy company to offer relationship prediction at this level of granularity and accuracy.
cM Explainer™ is fully integrated into the MyHeritage platform to shed light on any DNA Match found on MyHeritage, and is also available as a free standalone tool to benefit individuals who have tested with other DNA services.
How cM Explainer™ works
cM Explainer™ was developed by MyHeritage in collaboration with Larry Jones, developer of the cM Solver technology. We exclusively licensed this technology from Jones, and our Science team enhanced it further over a period of five months to create an industry-leading solution for genetic genealogy that is exclusive to MyHeritage. Among the enhancements are an age algorithm developed by MyHeritage’s Science team that greatly enhances the prediction by adjusting the probability of each possible relationship, and a slick user interface that displays possible relationships and their probabilities. cM Explainer™ includes useful features such as the ability to filter the predictions by full and half relationships, and to display the probable most recent common ancestor(s) (MRCA) of a match.
The ages of the two people who match each other are instrumental in predicting their relationship. They help rule out impossible relationships and adjust probabilities when multiple relationships are possible. For example, half siblings typically share the same amount of DNA as a grandparent and grandchild. But if the two people are of a similar age, they are probably half siblings. If they are 60 years apart, they are more likely to be a grandparent and grandchild. Other relationships may be possible for the same amount of shared DNA, such as an uncle and nephew, and knowing the ages can help determine which one is more likely. In many cases, the ages don’t make a selection clear-cut, but they affect the probability of each possible relationship, providing useful predictions you can apply to your research.
To maximize the accuracy of the relationship predictions, MyHeritage’s Science team developed an age algorithm by first examining age difference distributions among parents and children, and siblings (calculated separately for full and half siblings), based on extensive research using empirical aggregated data from family trees.
We further derived age difference distributions for all other relationships by combining those for parents, siblings, and children along a standard genealogical path. For example, the distribution of the age difference between an uncle and his nephew (see bottom graph below) is estimated by considering all potential ages of the nephew’s parent, and then adding the age difference between the nephew and his parent (see middle graph) and the age difference between the parent and the uncle (see top graph). On the graphs below, you can see that the average age difference for Parent, Uncle/Aunt, and Parent’s Cousin are similar, but the distribution is more widespread for Uncle/Aunt, and even more so for Parent’s Cousin because of the additional age differences between siblings. More generally, using the age difference allows us to rule out some relationships and assign more accurate probabilities to the remaining possible relationships. Since shared DNA and age difference complement one another, this method provides better results than those provided by shared DNA alone, and is useful even when only one individual’s age is known.


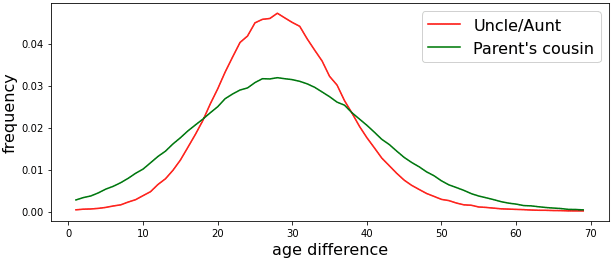
Empirical age difference distributions for Full Siblings (top), Parent (middle), and Uncle/Aunt and Parent’s Cousin (bottom)
A game changer for genetic genealogy
Existing relationship prediction tools often suggest a range of possible relationships that is too broad to be useful, such as “3rd to 5th cousin”, or list many relationships with the same probability, leaving the user confused. cM Explainer™ simplifies the predictions considerably by taking into account the age of each match and assigning a unique probability to every relationship. MyHeritage further reduces confusion by avoiding ambiguous relationship terms used by other tools, such as “first cousin once removed” (sometimes written in excessively technical codes such as “1C1R”), and instead replaces them with clear relationships such as “parent’s first cousin” or “first cousin’s child”, as the case may be.
cM Explainer™ provides clear one-sided relationships that are gender aware, like “Aunt” instead of reciprocal relationships like “Aunt/Uncle/Niece/Nephew” that other tools provide.
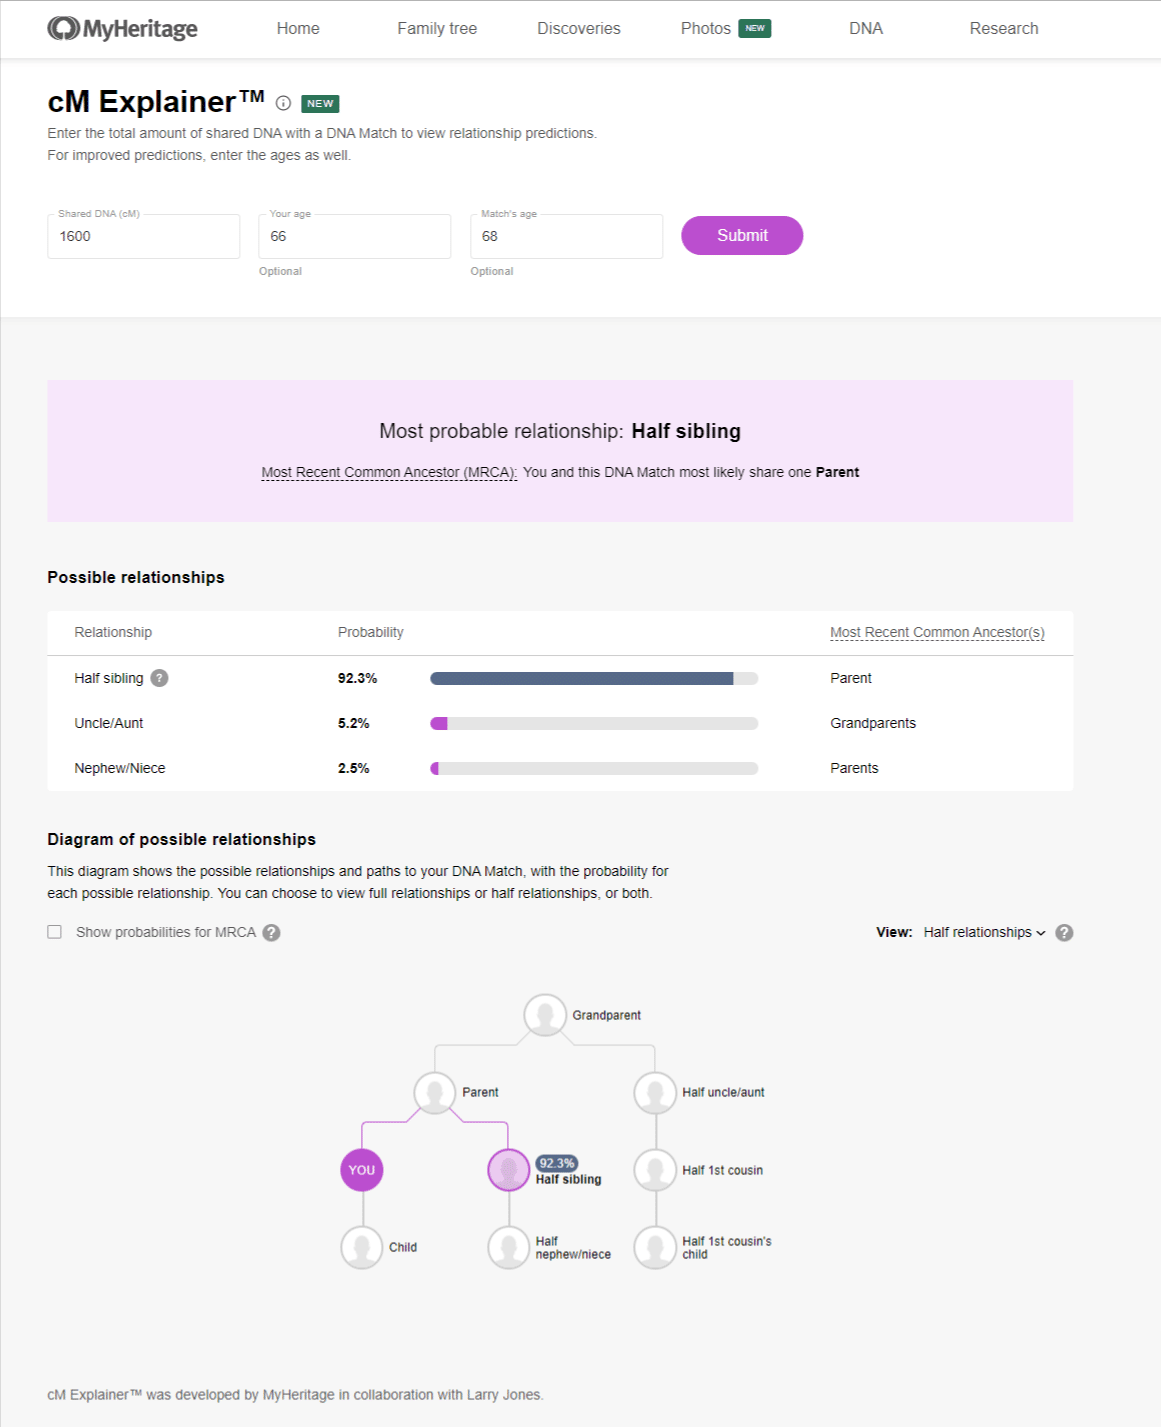
For example, in a DNA Match where there are 1,600 cM of shared DNA between two people who are age 35 and 40, MyHeritage will tell the user simply that the match is most likely a half-sibling with 90.4% probability, whereas other tools would state a 100% probability for the match to have any of the following possible relationships: grandparent, aunt or uncle, half sibling, niece or nephew, or grandchild, leaving the user baffled. This makes cM Explainer™ the most useful tool for relationship prediction of DNA Matches on the market, whether you’re just starting out or are an experienced genetic genealogist.
Using cM Explainer™ for MyHeritage DNA Matches
For users who have DNA results on MyHeritage, select “DNA Matches” from the DNA tab on the main navigation bar.
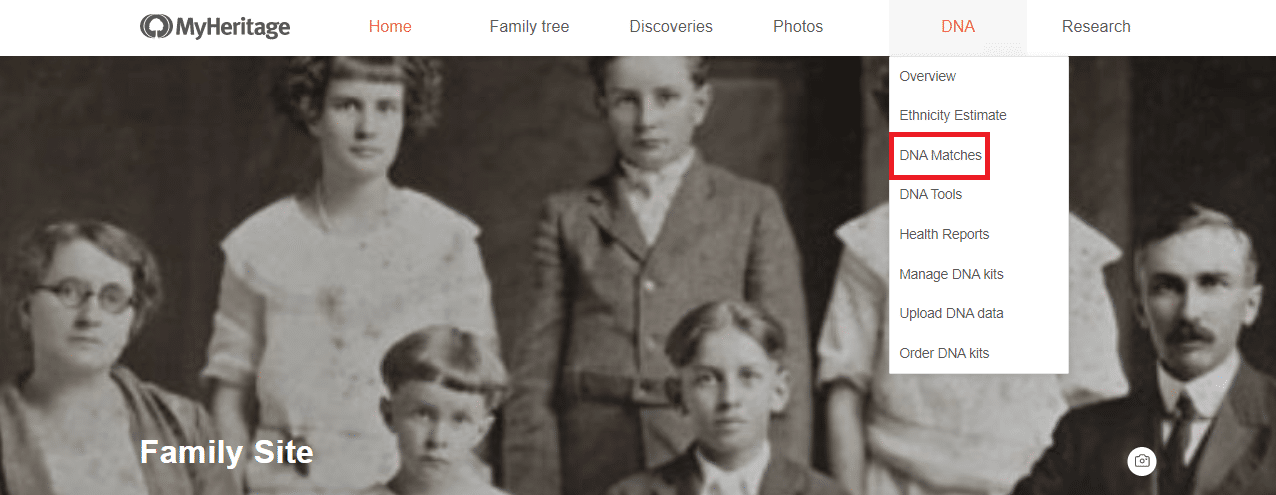
Accessing DNA Matches (click to zoom)
The page lists all your DNA Matches. Each DNA Match card shows one or more probable relationships between you and a match. This replaces the broader range of “Estimated relationships” that previously appeared.
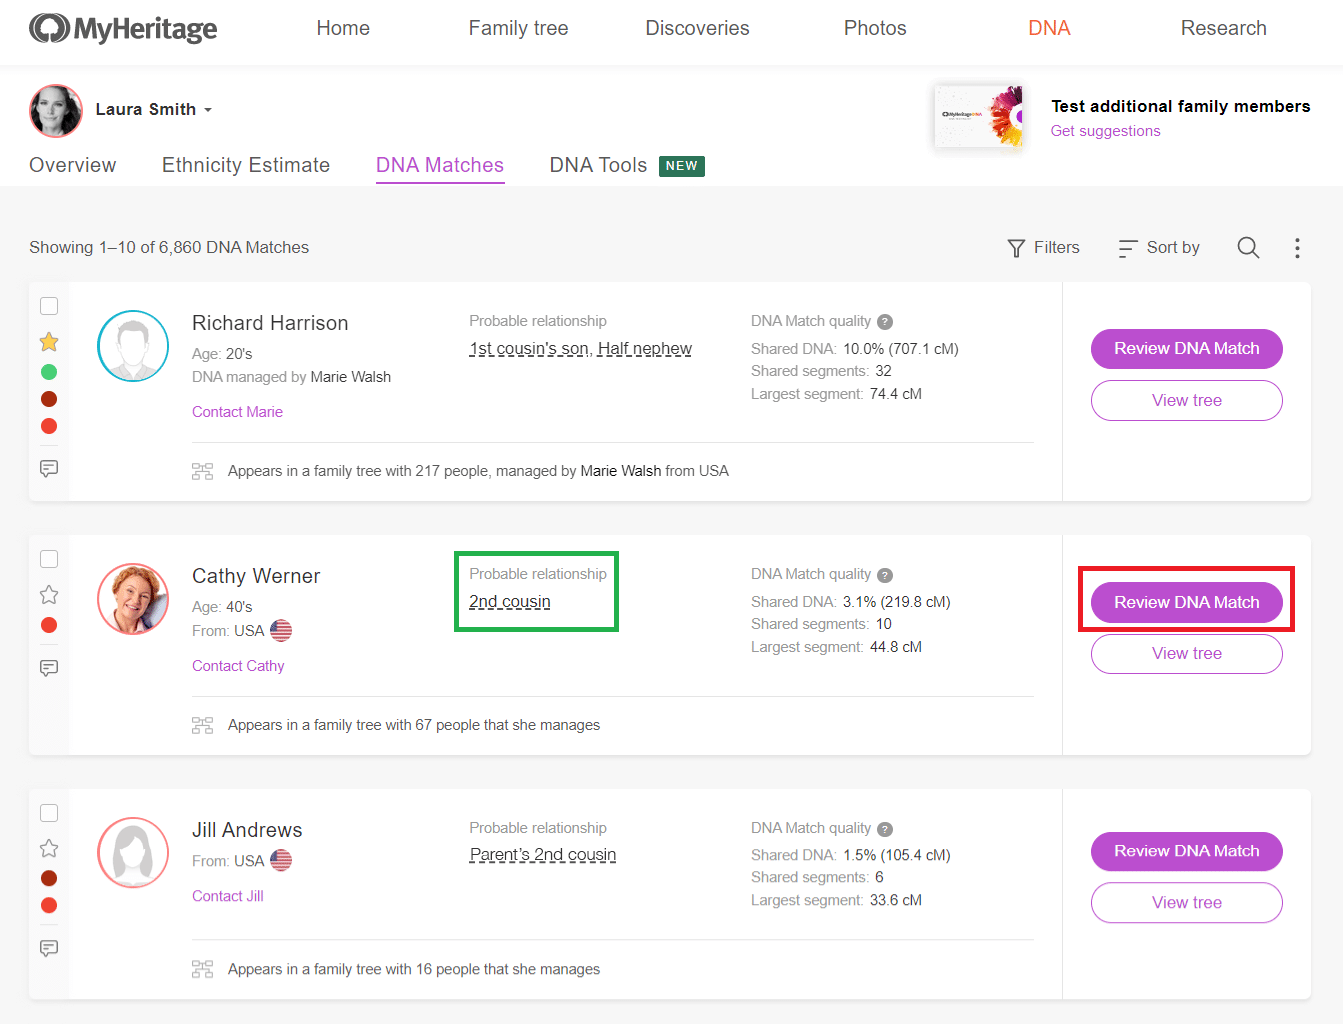
DNA Match list showing probable relationships (click to zoom)
To obtain more information on a probable relationship, click it (for example, the relationship marked with a green rectangle in the above screenshot). A popup will appear displaying all possible relationships estimated by MyHeritage, and their respective probabilities.
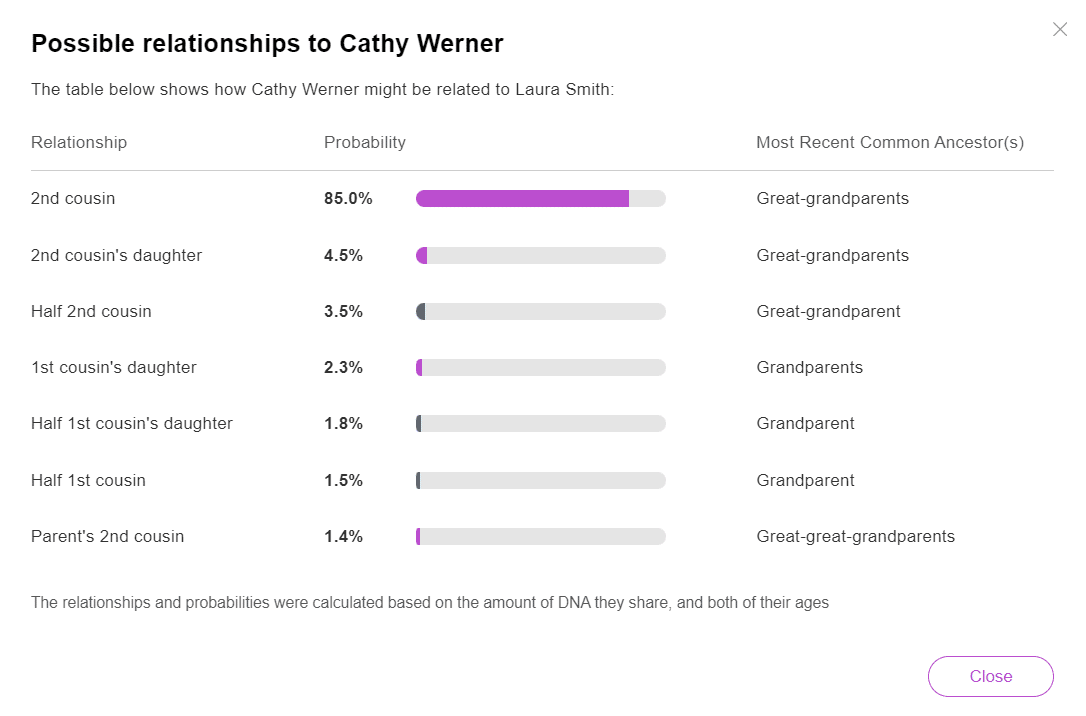
Possible relationships between Cathy Werner and Laura Smith (click to zoom)
The probable relationship indicates how the match is related to you. If it says “Aunt”, this means the match is your aunt, not that you are the aunt of the match.
More information on possible relationships appears on the Review DNA Match page. To get there, click the “Review DNA Match” button (marked with a red rectangle in the above screenshot of the DNA Match list).
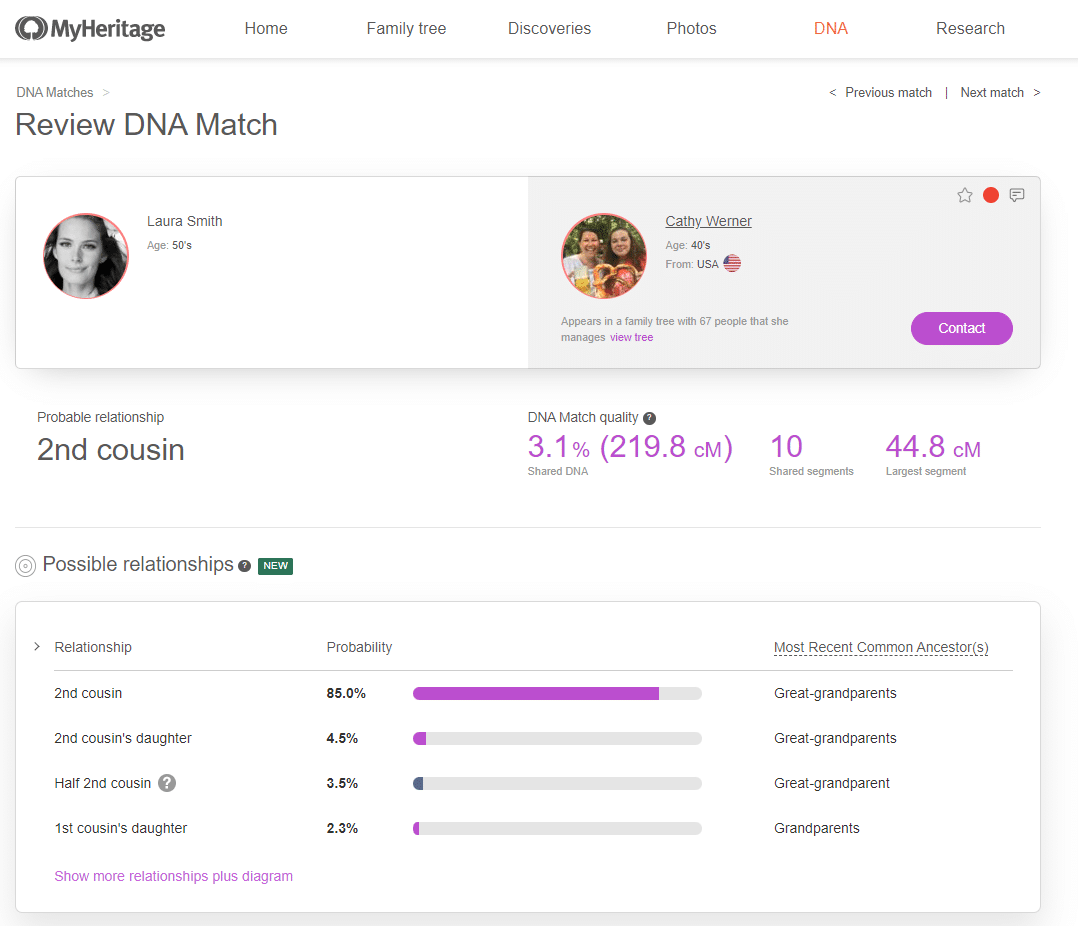
Review DNA Match page listing possible relationships (click to zoom)
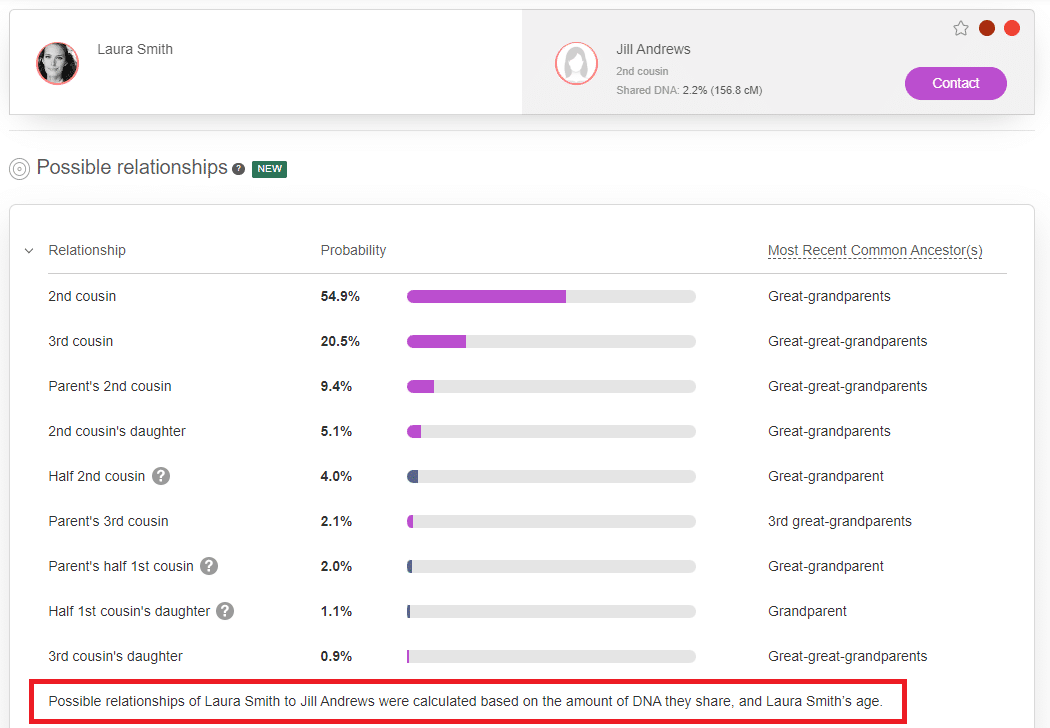
A new section was added to the Review DNA Match page, called “Possible relationships”. It shows how this person who is your DNA Match might be related to you, together with the probability for each relationship and the likely Most Recent Common Ancestor(s). This term, often abbreviated to MRCA, is the closest shared ancestor from whom you and your DNA Match are directly descended. This could be a single ancestor or a pair, depending how the match is related to you. In a full relationship the MRCA will be a pair of ancestors, and in a half relationship, it will be a single ancestor. For example, with a full first cousin, your MRCA are your grandfather and grandmother. But with a half sibling, your MRCA is one of your parents, not both.
The list of possible relationships displays the top 4 relationships, listed in descending order based on their probabilities. Click “Show more relationships plus diagram” to view other possible relationships having lower probability, as well as a diagram that shows the paths to those possible relationships.
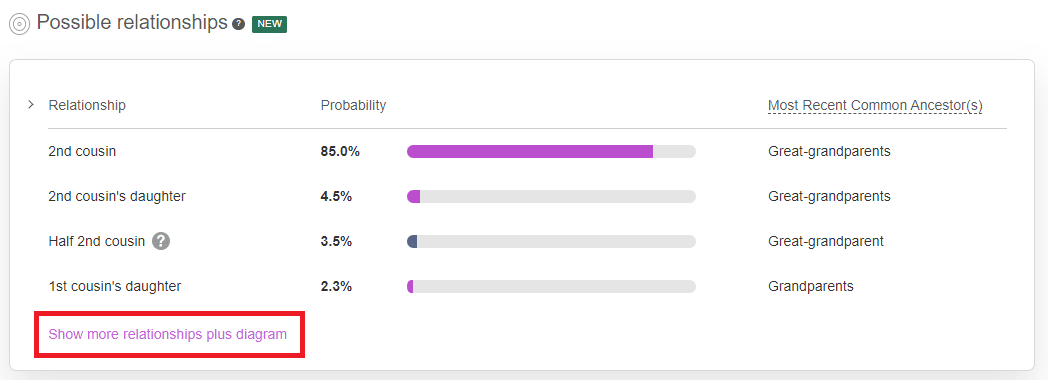
Top possible relationships and a link to view all of them (click to zoom)
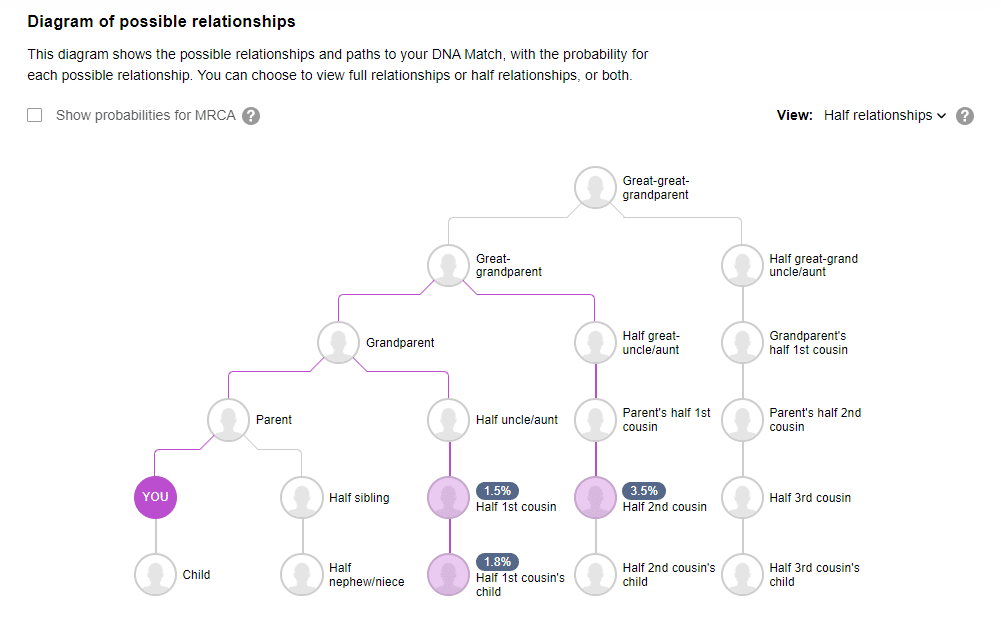
The diagram of possible relationships displays the relationship paths to the DNA Match, along with the probability for each relationship.

Diagram of possible relationships (click to zoom)
Use the drop-down on the top right to have the diagram to show full relationships, half relationships, or all relationships. This ability is unique to MyHeritage, and allows you to focus on specific relationship types.

Filtering the diagram by relationship type (click to zoom)
The reason we provided this selector is to simplify the diagram. The probabilities always add up to 100%, but if you are viewing only full relationships or only half relationships, some of the possible relationships may not be displayed and the probabilities shown will add up to less than 100%.
In the example shown above, there are 4 options of full relationships, the most probable one being a 2nd cousin with a probability of 85%. Selecting “Half relationships” from the drop-down shows 3 additional options having a much lower probability.
Viewing half relationships (click to zoom)
Selecting “All relationships” from the drop-down displays all 7 possible relationships, together with their probabilities, as shown below.
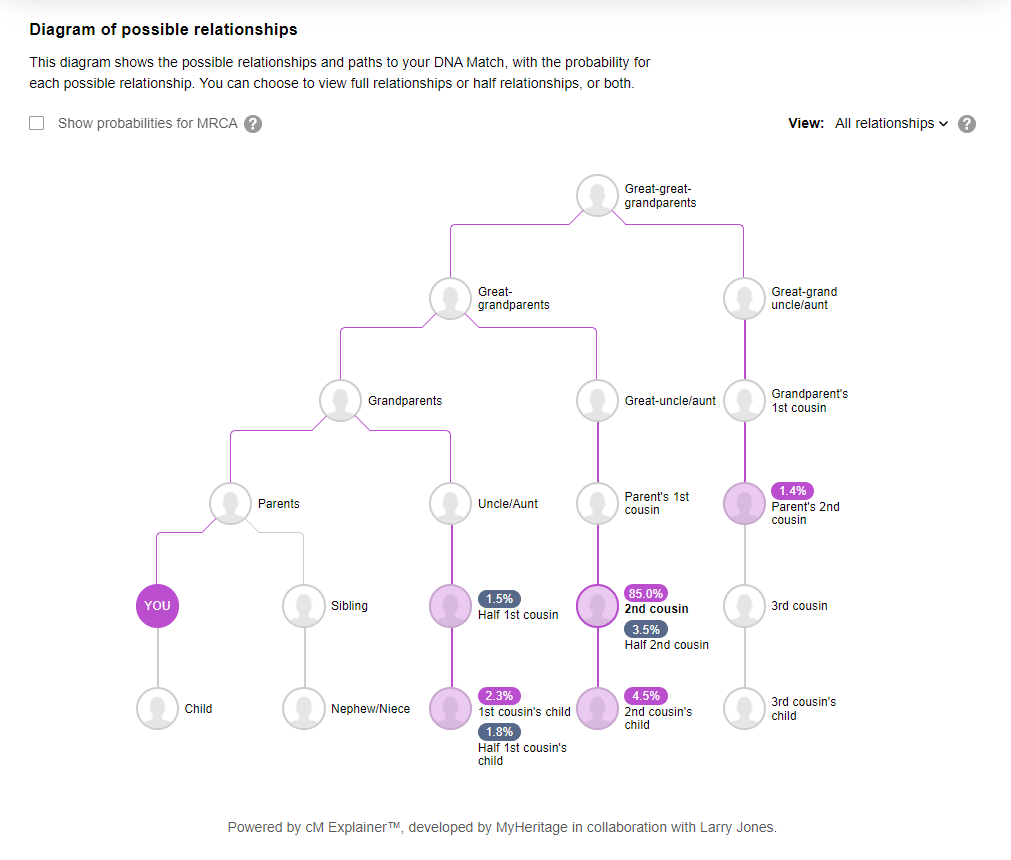
Viewing all possible relationships (click to zoom)
Another unique feature of cM Explainer™ is the ability to show MRCA probabilities. Each MRCA probability is the overall probability that you and this DNA Match share a specific most recent common ancestor (MRCA). To view probabilities for MRCA, click the checkbox shown below, marked with a red rectangle. The MRCA probabilities are marked with a green rectangle.
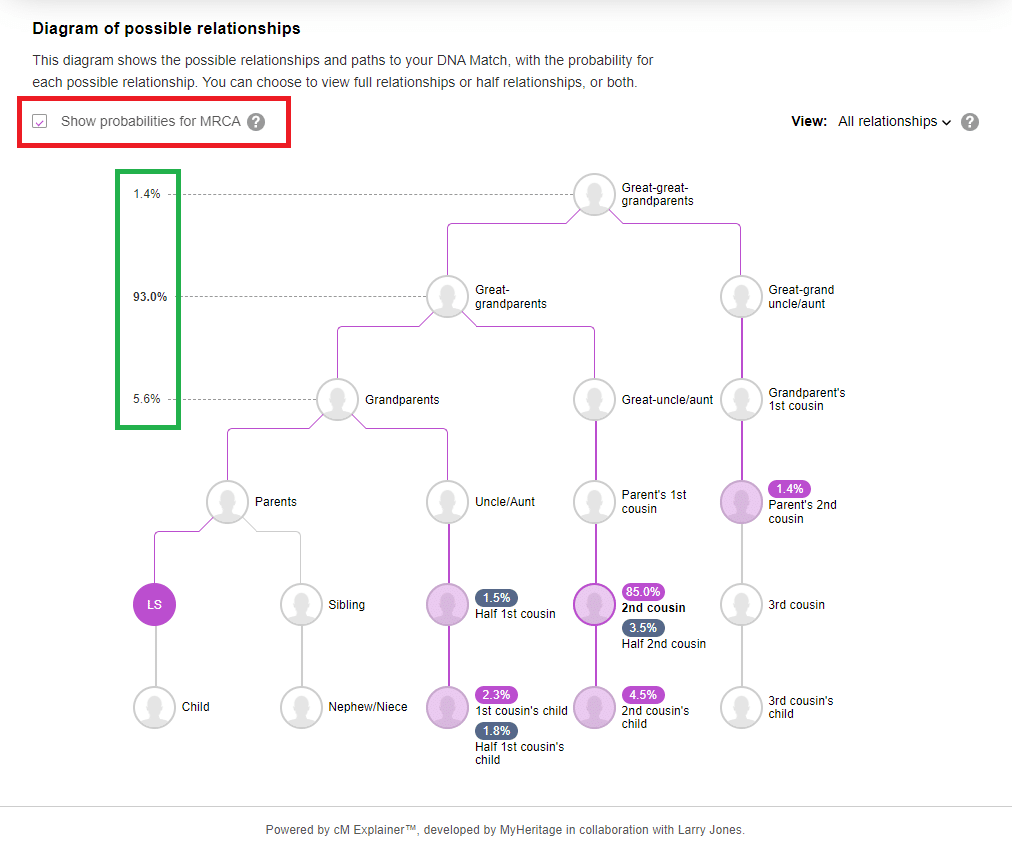
Showing MRCA probabilities (click to zoom)
In this example, the MRCA is very likely your great-grandparents at 85% probability. Note that the MRCA is described based on the relationship to you, not your DNA Match. For example, your great-grandparents might be more distant ancestors for your DNA Match, such as great-great-grandparents.
The examples that were shown above are from a case where the ages of you and your DNA Match are known. While cM Explainer™ provides its most accurate relationship predictions when the ages of both individuals are known, it can also predict relationships with probabilities in cases where only one individual’s age is known, or none of the ages are known (unlikely because you always know your own age or the age of a person whose DNA kit you are managing). Some users may choose not to indicate their age in their account, and others may mark their age as private, so the age of a DNA Match is not always known.
Below the list of possible relationships is an explanation of how the predictions were calculated. If only one age is known, it will say so, as in the example below.
Relationship predictions when only one age is known (click to zoom)
Using the standalone cM Explainer™ tool
In addition to viewing cM Explainer™ predictions for DNA kits that are on MyHeritage, we’ve added a standalone tool so individuals with DNA results from other services can also benefit from cM Explainer™. The standalone tool is free and can be used without even having to sign up to MyHeritage.
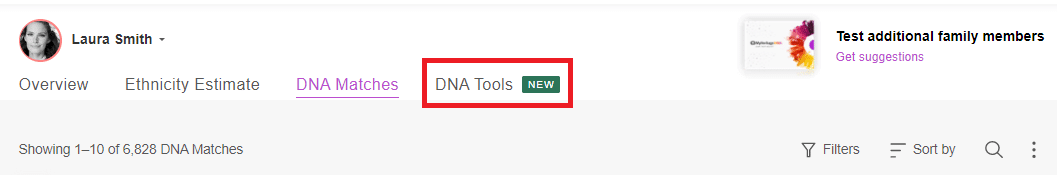
To get started, visit myheritage.com/cm. You can also access the tool by selecting “DNA Tools” from the DNA menu on the main navigation bar, or clicking the “DNA Tools” tab from any page of your DNA results.
DNA Tools tab (click to zoom)
A new card is displayed for the cM Explainer™ tool. Click the “Explore” button on that card to access the tool.

Accessing cM Explainer™ from the DNA Tools page (click to zoom)
Standalone cM Explainer™ (click to zoom)
Enter the amount of shared DNA between two matches, and their respective ages, if known. If you don’t know one of the ages, or don’t know both ages, that’s fine. cM Explainer™ can still calculate the relationship probabilities. However, the relationship prediction will be better when you enter ages, so if you are in touch with a DNA Match whose age is not known, simply ask that person for their age and explain why you need it. You can then use it in the standalone cM Explainer™.
Viewing possible relationships in the cM Explainer™ standalone tool (click to zoom)
The user interface for the cM Explainer™ tool is almost identical to that shown previously.
In the following example with 500 cM, only one person’s age is known, and the tool still delivers results that have a high probability: this match is a parent’s 1st cousin, with 73.1% probability.
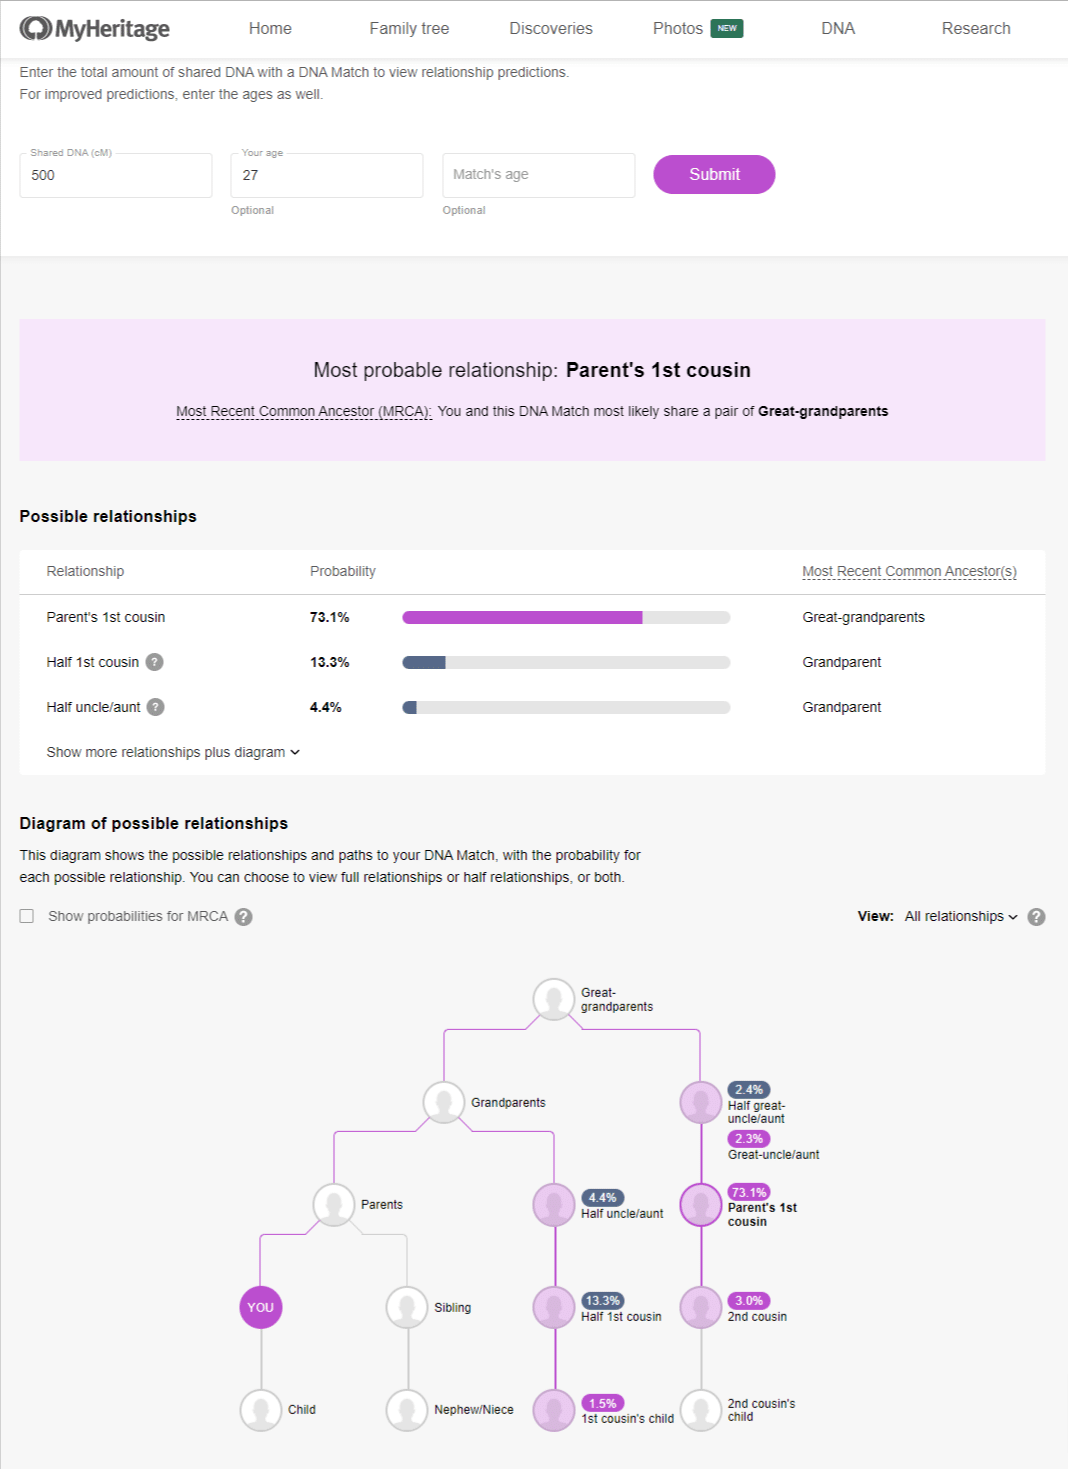
Results when only one age is known (click to zoom)
It’s free!
cM Explainer™ is a free feature and is available to anyone with DNA results on MyHeritage. It is also available as a free standalone tool for non-MyHeritage customers on myheritage.com/cm.
Endogamy and pedigree collapse
In some situations, the relationship to a DNA Match may be more complicated. When there is endogamy or pedigree collapse, the two individuals may have shared DNA from multiple common ancestors, and would therefore have a larger amount of shared DNA (a higher cM value) than expected for the same relationship. To avoid an increase in complexity and confusion, cM Explainer™ assumes that endogamy or pedigree collapse are not present. More experienced genetic genealogists need to take this into account when reviewing the relationship predictions provided by cM Explainer™.
Summary
At MyHeritage, we’re committed to developing new features and tools to help improve your family history research, and in the domain of DNA testing, to help you better understand your DNA Matches. cM Explainer™ is a powerful addition to our product suite that furthers this mission by removing much of the guesswork that was previously needed to analyze possible relationships to your DNA Matches.
This makes cM Explainer™ a game changer for genetic genealogy.
Explore your DNA Matches today or try the cM Explainer™ tool to usher in new discoveries about your matches. Enjoy!