Emma Willard: The 19th-Century Educator Who Drew Magnificent Maps of History
- By Daniella


They say a picture is worth a thousand words. While language gives us the capability to convey complex and abstract concepts, it is still much easier for our brains to understand certain ideas when they are presented visually.
This explains the popularity of infographics in the 21st century. Seeing a graphic representation of data helps us intuitively and instantly grasp ideas that may take our brains a lot more work to understand when they are explained in words.
However, the idea of an infographic is not new. Graphs, maps, and timelines have been used for centuries to help people understand ideas better. In fact, the idea of a family tree is exactly this: a visual representation of an abstract concept. Your actual family doesn’t look like a tree in reality! But when you plot it out on paper, it’s easiest to understand the relationships by creating a sort of map that connects between the individuals in the family, and because it spreads out and has branches that call to mind the image of a tree — the tree has become the most widespread image associated with the concept of family.
Of course, family trees, however elaborate, are a relatively simple concept to grasp. The challenge is in trying to represent more complex data visually. In the days before Excel and Powerpoint, these visualizations needed to be drawn by hand — and they required a great deal of precision, talent, and artistic prowess.
No one mastered the art of the hand-drawn infographic like Emma Willard, an early 19th-century American educator and women’s rights activist whose work literally changed the way people saw history.
A budding education system
Emma was born in 1787 in Berlin, Connecticut. The United States of America won its independence only 6 years before, and its public institutions were still in the process of development — including its rapidly expanding education system. The women in Emma’s generation were the first to receive an education outside the home, and Emma only began attending school at age 15. She became a teacher herself within just 2 years.
Emma was frustrated, though, with the limitations imposed on female students. Women often weren’t taught “masculine subjects” like science and history, but Emma believed women were just as capable of mastering these subjects as men, and had just as much right to gain access to them.
Maps of time
The invention of new printing techniques in the early 1800s created a thriving market for printed educational material and textbooks.
By the 1820s, when Emma began publishing her own textbooks, she was up against a lot of fierce competition. To stand out from the crowd, she began drawing unique illustrations — visual timelines unlike anything anyone had ever seen before.
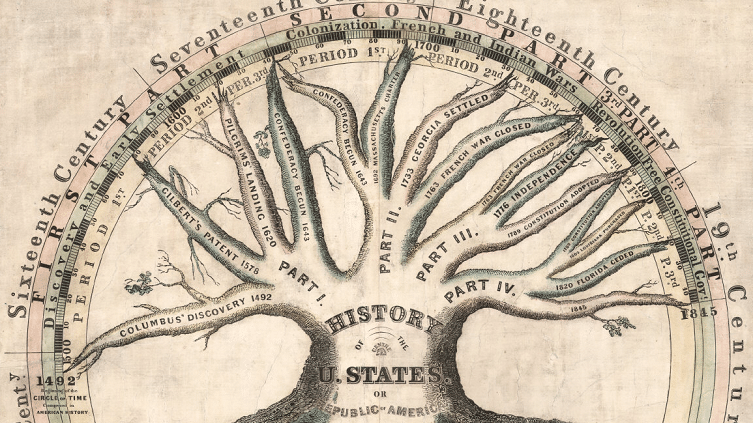
Emma’s infographics don’t just represent the chronology of historical events: they translate the dimension of time into the 3 dimensions of space, by using depth and perspective to indicate how “close” (recent) an event feels to the observer.
![Emma Willard’s “Picture of Nations” (Credit: David Rumsey Map Collection, David Rumsey Map Center, Stanford Libraries [CC BY-NC-SA 3.0])](https://blog.myheritage.com/wp-content/uploads/4545001.jpg)
Emma Willard’s “Picture of Nations” (Credit: David Rumsey Map Collection, David Rumsey Map Center, Stanford Libraries [CC BY-NC-SA 3.0])
It’s no wonder, then, that she eventually began to apply this concept to time.
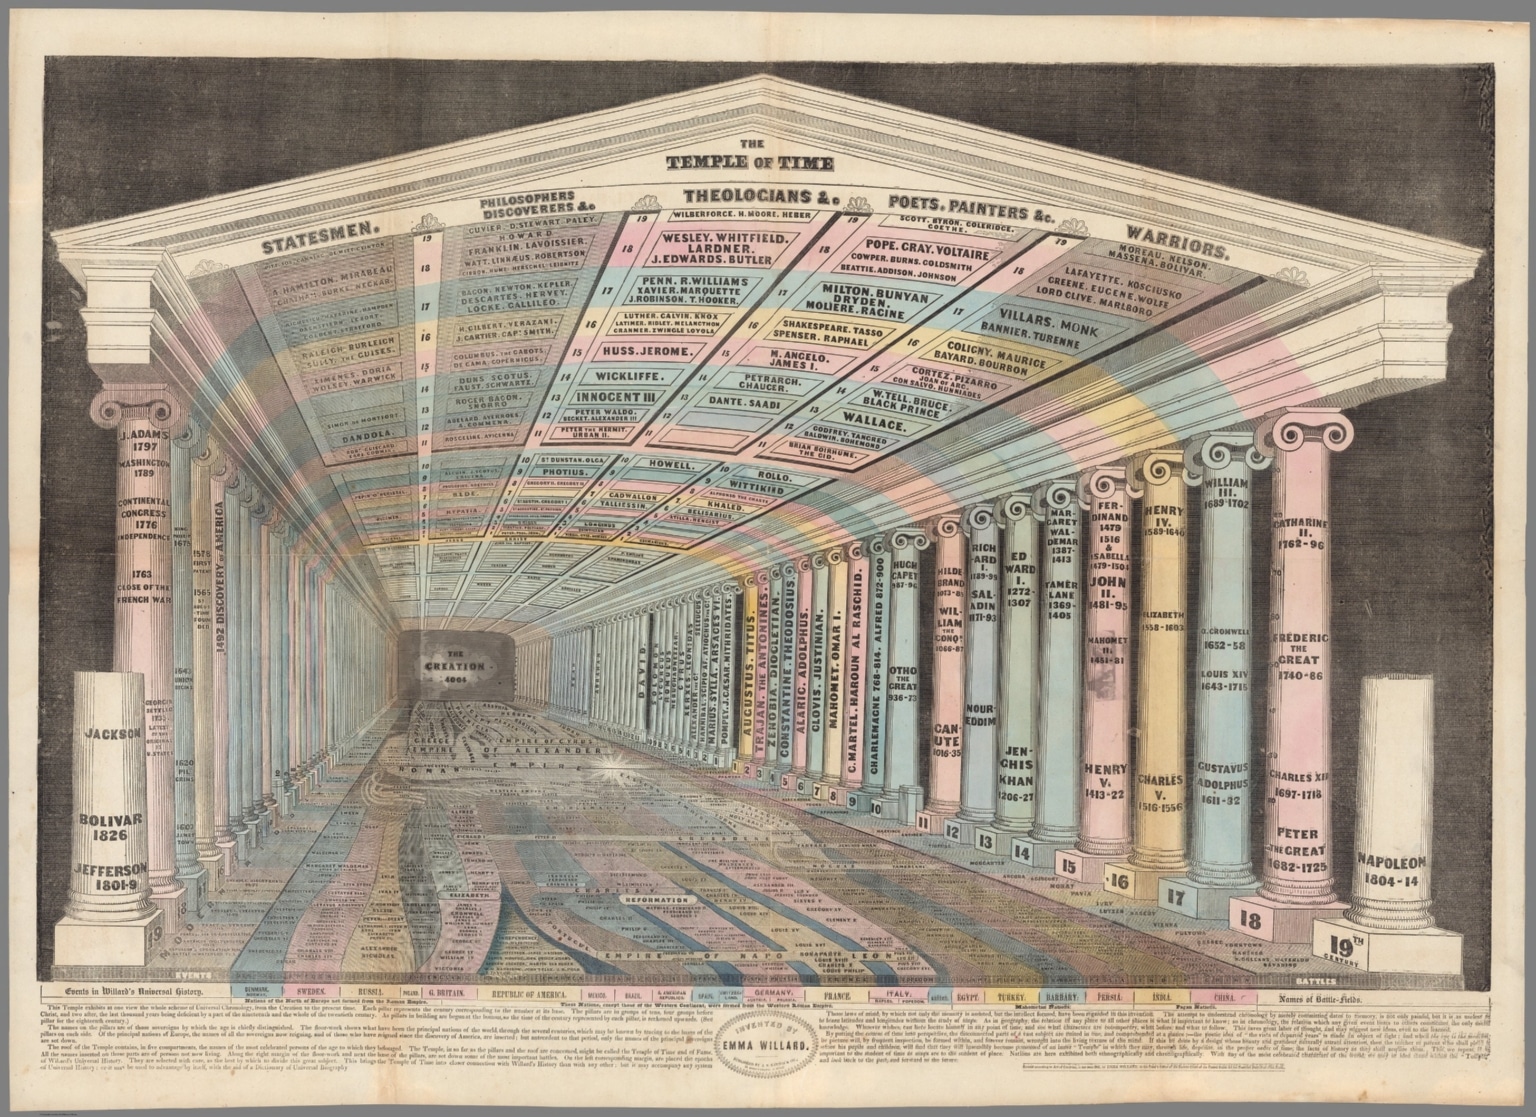
One of her most remarkable works, “The Temple of Time” (1846), almost invites the student to stand inside the conceptual temple and become part of the scenery, viewing the events and historical figures — represented by pillars that shrink into the distance — as an observer looking back on the past.

Emma Willard, The Temple of Time (Credit: David Rumsey Map Collection, David Rumsey Map Center, Stanford Libraries [CC BY-NC-SA 3.0])
Viewing your family tree as a timeline
Using a visual “map of time” can also be extremely useful in family history research. That’s why we introduced the Family Tree Timeline, which allows you to view your family tree in a timeline format and see how events in your family history unfolded over time. Read this article on the MyHeritage Knowledge Base to learn how to use it.


