


Neat!!! Always interested in more info.
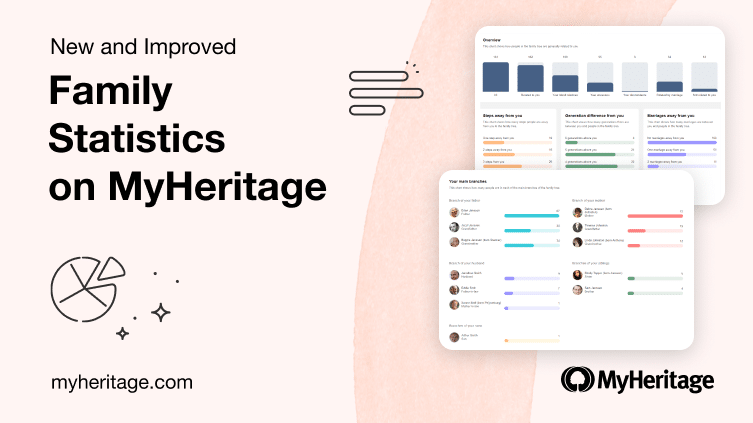
New and Improved Family Statistics on MyHeritage
Ever wondered which of your relatives lived the longest, the average age of your relatives at marriage, or which first names are the most common in your family? Did you know that there’s a handy section of the MyHeritage website that can tell you all of this and much more? We’re delighted to announce that our useful Family Statistics feature has just received a major upgrade! Family Statistics is a totally FREE feature that provides dozens of enlightening and fun insights about your family. If you love spotting trends and analyzing data, you won’t want to miss it.
Overview
Family Statistics shows you dozens of different analytics for your family tree. Using the metrics on the page, you can better understand your family history across several categories: places, ages, births, marriages, children, divorces, and now, relationships.
Among the many interesting facts that are showcased, you’ll learn which couple was married the longest and which pair of siblings had the largest age gap. You’ll also discover who had the most children, who was married the most times, and even find out the most common birth months in your family. Think you know your family tree inside and out? Family Statistics may give you a few surprises.
What’s New
The current update includes a facelift of the design for a more contemporary look. The display is larger, making the page easier to read. In this update, we’ve also added new insights and made the overall user experience on the page more enjoyable.

Family Statistics new design (click to zoom)
In the new design, the navigation between the categories has moved from the left hand panel to the top of the page, which allows for an enlarged view of each page component.
Accessing Family Statistics
To view the statistics for your family site, hover over the Home tab on the navigation bar and select “Family Statistics”.
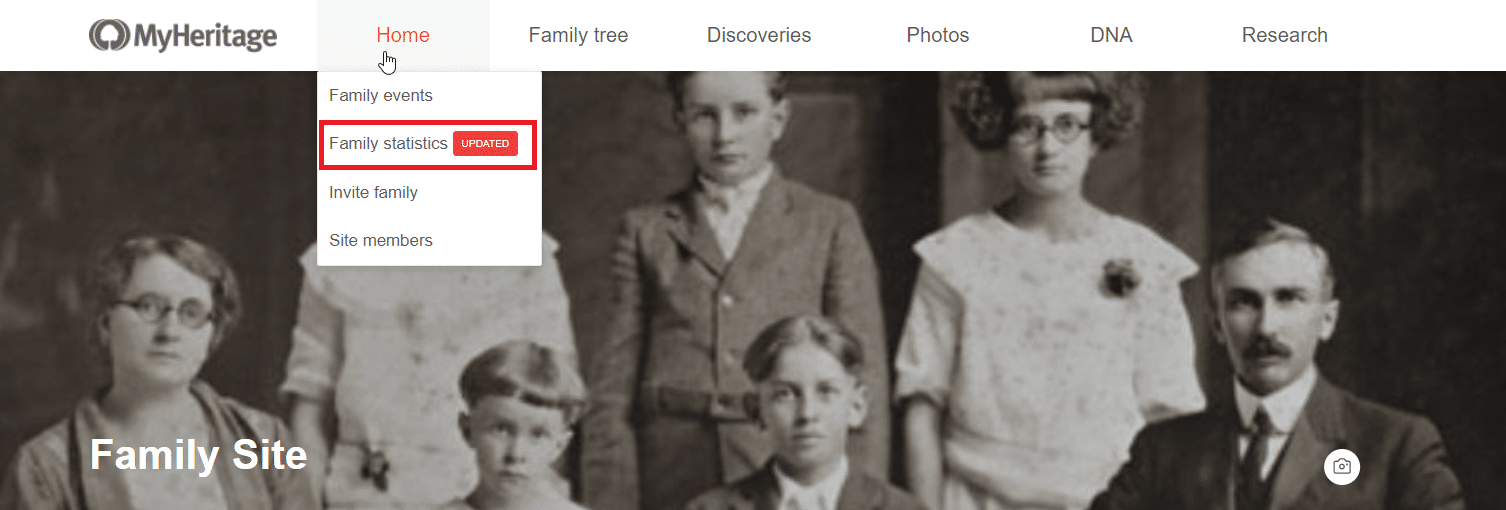
Accessing Family Statistics
If you manage multiple family trees on MyHeritage, you can select any tree to view its statistics from the dropdown. You can also select “All family trees” to view aggregated statistics of all your family trees.
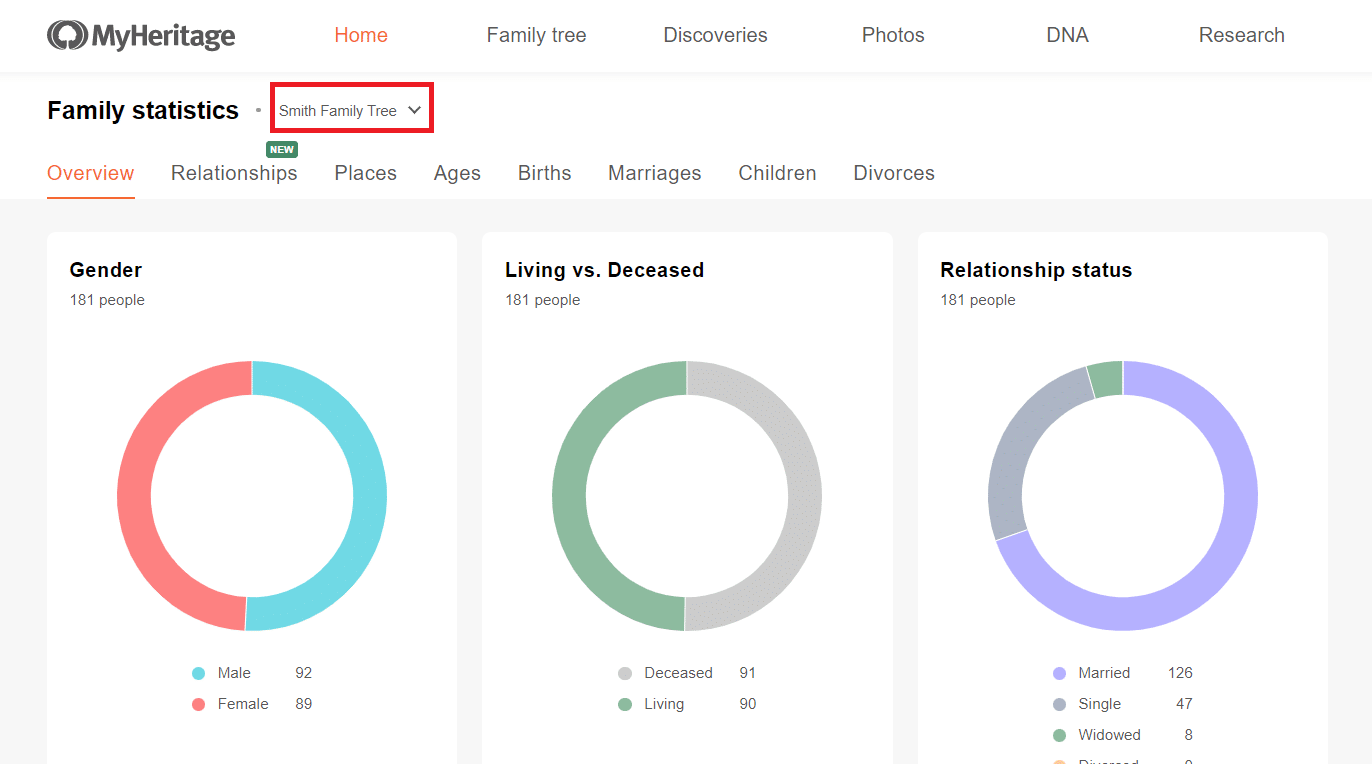
Selecting a family tree (click to zoom)
For users with very large family trees, preparing the data for the first time can take several minutes. Otherwise, the data will be generated and displayed quickly.
Thanks to this update, the page is now mobile-friendly and can also be viewed on your phone’s web browser.
What’s New: Relationships
Beyond the visual improvements, we’ve added a new category of metrics: Relationships. The Relationships page displays 6 charts that provide a deeper understanding of how the people in your family tree are related to you.
Click on the Relationships tab to open the page.
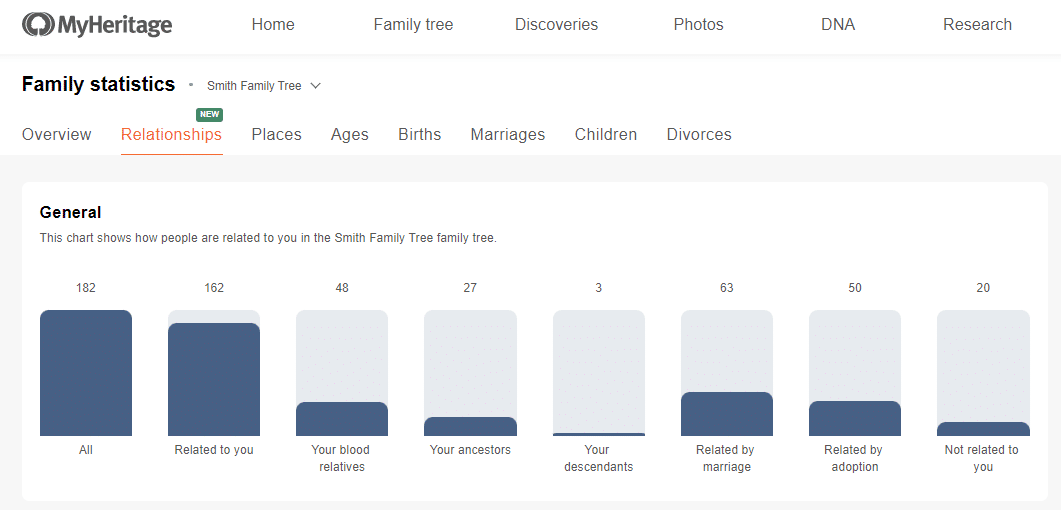
Relationships page: General chart (click to zoom)
The General chart at the top of the page displays subsets of people in your family tree based on their relationship to you, and counts the number of people in each one. For example, “All” includes all people in the tree; “Related to you” includes the subset of people who actually have a relationship path connecting you; “Your blood relatives” includes everyone in the tree with whom you share a common ancestor, and so on. Empty subsets will not be shown, so if, for example, you do not have any descendants, the corresponding subset “Your descendants” will not appear in the chart.
All charts on the Relationships page are clickable, making Family Statistics into a powerful springboard for working with your family tree. Clicking on any subset (bar) in the chart will open a new window that displays the corresponding individuals in List view of your family tree. In the example below, we clicked on “Your ancestors”, which then lists the 53 ancestors.
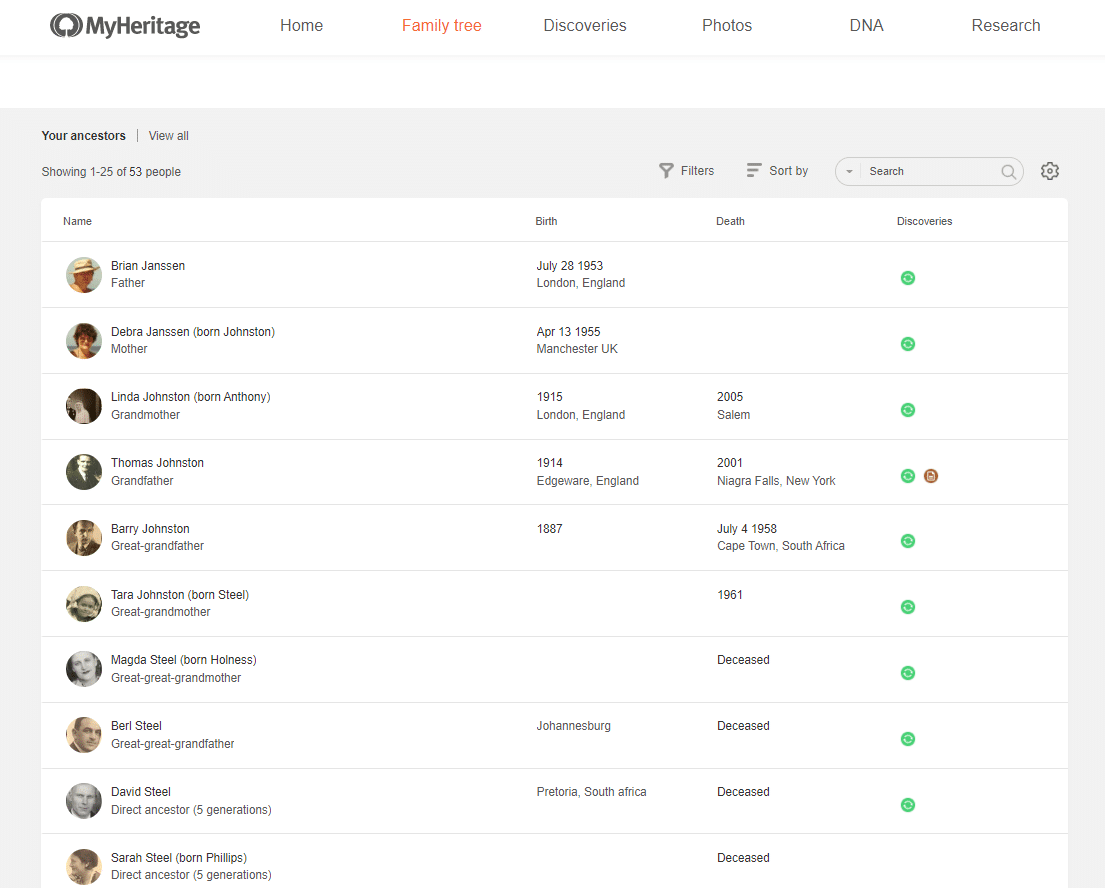
List view showing only your ancestors (click to zoom)
In List view you’ll see more details about each ancestor, including their relationship to you, dates and places of birth and death, and whether you have discoveries like Smart Matches™ or Record Matches for them. The List view page is very convenient to work with. You can edit any tree profile from here to enrich its details, or click any profile to view more information about the individual in a panel on the left.
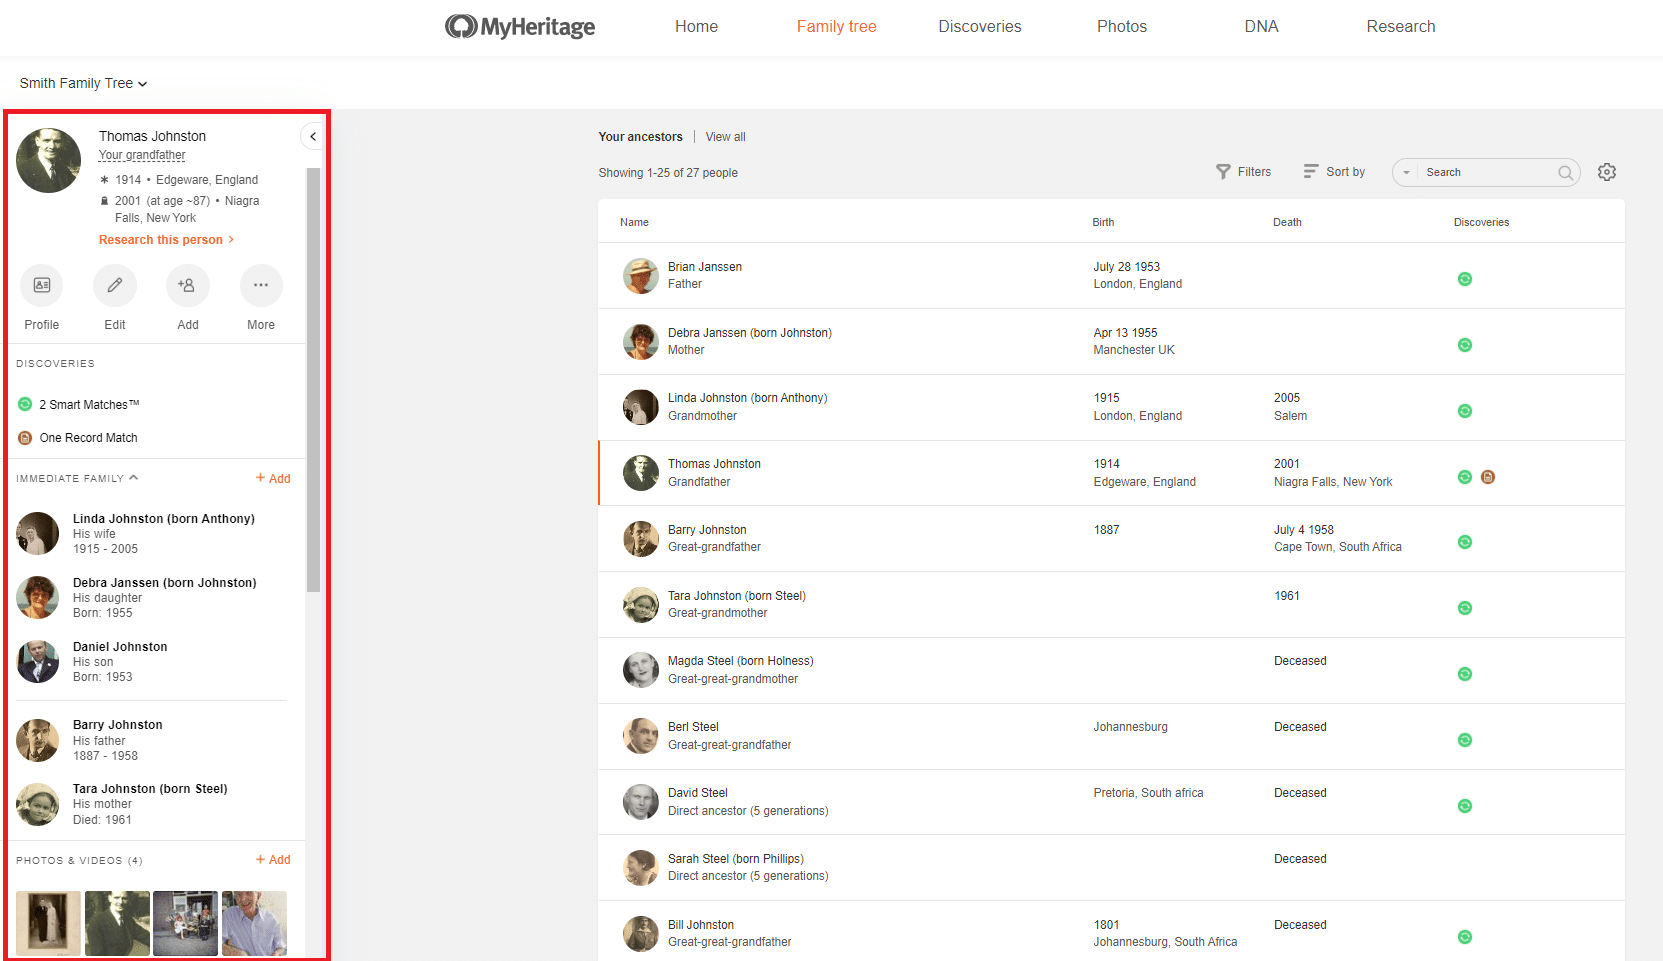
Left hand panel displaying a profile from List view (click to zoom)
Moving back to the Relationships tab, as you scroll further down the page, a series of 3 charts is displayed that show how closely you are related to the individuals in your family tree.
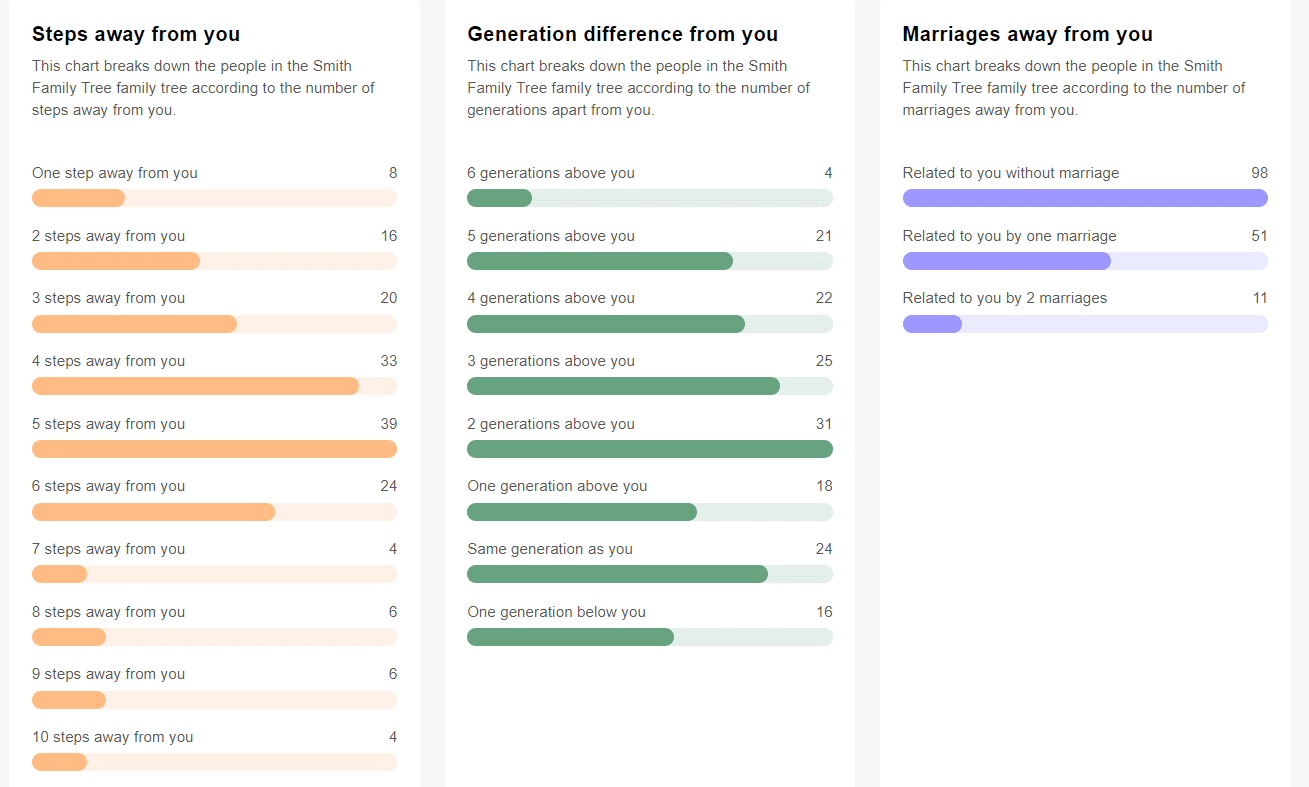
Charts showing how you are related to the people in your tree (click to zoom)
“Steps away from you” indicates how many “hops” exist between you and another individual in the tree, ranked in order from the fewest number of steps to the greatest. Your closest relatives are one step away from you and include your parents, siblings, spouse(s), and children. Those who are two steps away from you include grandparents, uncles and aunts, nieces and nephews, parents-in-law and siblings-in-law, step-parents, and so on. The maximum number of steps in the chart is 10; if you have individuals in the family tree who are more than 10 steps away from you, they will be included in another entry labeled 10+.
The middle chart, “Generation difference from you,” indicates the generation gap between you and your relatives. Your generation includes your siblings, spouse(s), cousins, second cousins, their spouses, and so on. This chart is organized from the greatest number of generations away from you to the fewest. If your family tree dates back more than 7 generations, the maximum number listed will be 7+ generations above you.
The chart on the right, labeled “Marriages away from you”, indicates how many marriages make up the relationship path between you and your relatives. Individuals in the “Related to you without marriage” list are in fact your blood relatives. In the example above, the individual in question has 98 blood relatives in the family tree.
As before, you can click any entry to open List view, which shows you those individuals. This is a very handy way to see all individuals in your tree in your generation, all people related to you via marriage, and so on.
Further down the Relationships page is a section that displays the main branches of your family tree: those of your parents (including biological, adoptive, and foster parents, if applicable), grandparents, spouses, siblings, and children. For each branch, the number of individuals is displayed, and you can click any branch to explore those individuals in List view.
In the example below, for the user Laura Janssen, in addition to the branch of Laura’s father, Brian Janssen, we also see sub-branches for her paternal grandfather, Jozef, and her paternal grandmother, Beppie.
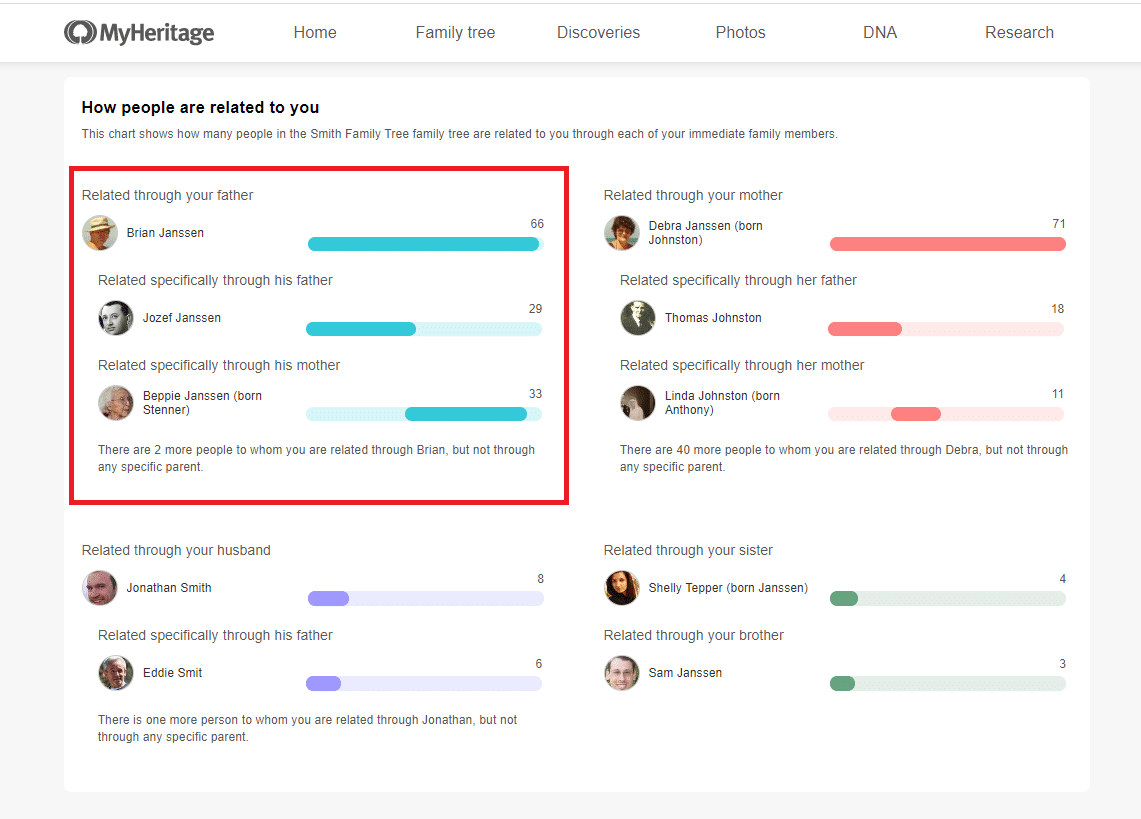
Branches indicating relatives through the paternal side (click to zoom)
Hover over any branch or sub-branch to see the percentage of individuals in the tree who belong to that branch of the family. You can click on any branch to view a list of all the individuals in this branch, i.e., all people who are related to you through this relative.
The last chart on the Relationships page shows a breakdown of your blood relatives – the people in the family tree who share a common ancestor with you. Relatives in this chart are grouped according to relationship type, for example, great-grandparents or second cousins. Click any card to see all blood relatives of that type in List view.
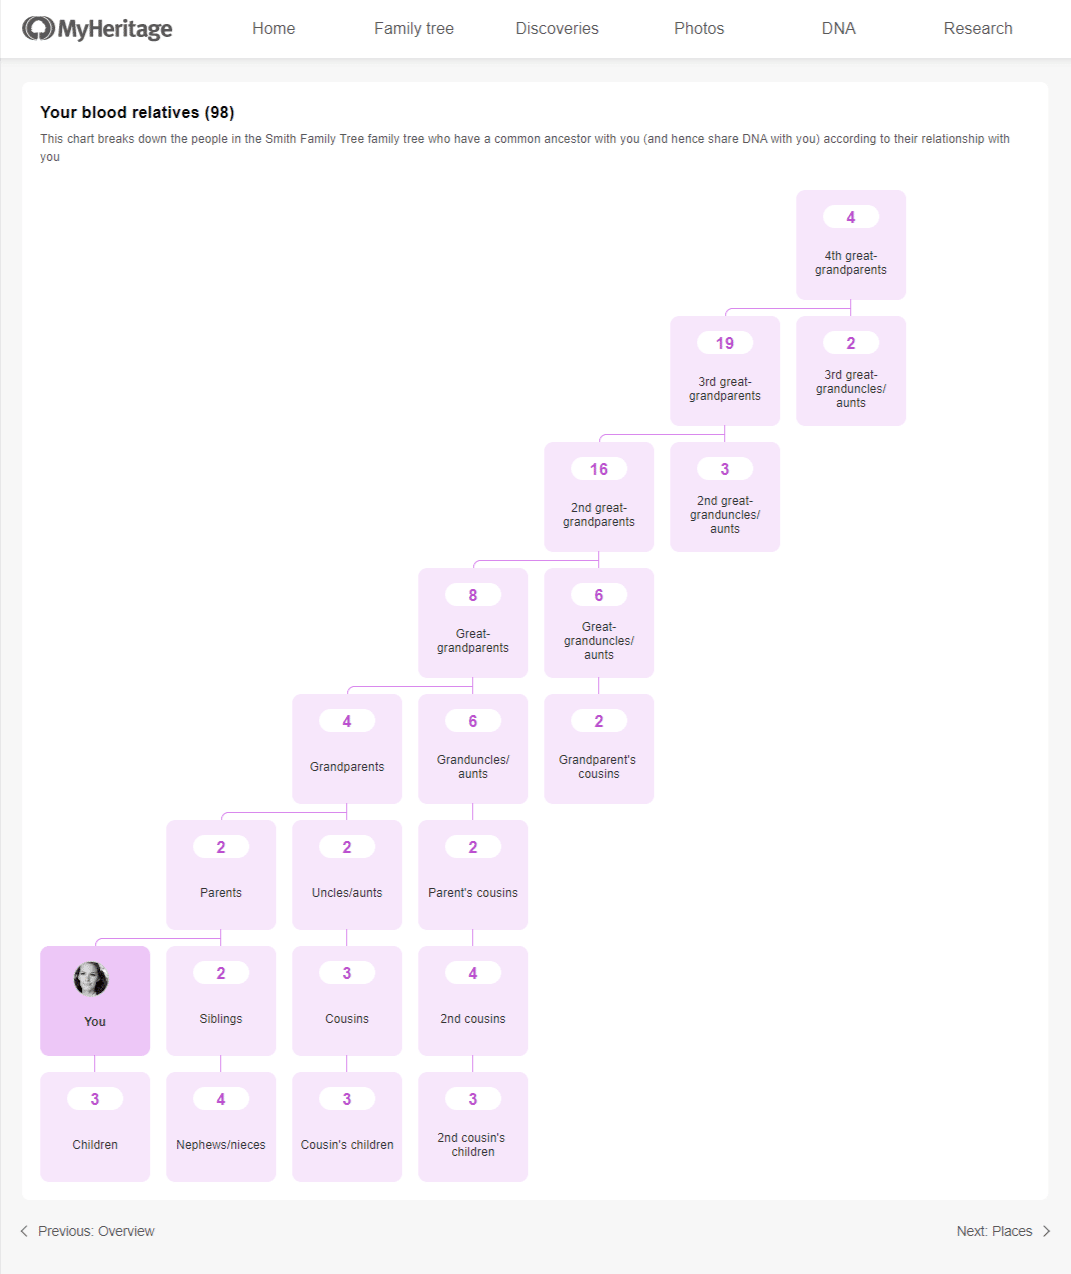
Click any card to view all your relatives with that type of relationship (click to zoom)
If you have a partial blood relationship, for example a sibling with whom you share only one biological parent, this will be indicated in the chart with a dotted line and a lighter-colored card.
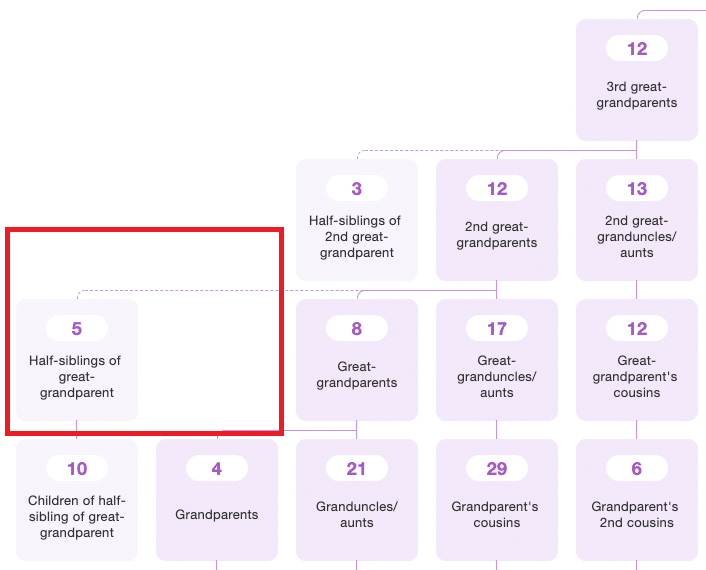
Half-siblings are indicated with a dotted line and lighter card color
Useful Tip
In addition to offering fascinating insights about your family tree, the new Relationships page can also help you spot and fix problems in your family tree. For example, the General chart (topmost on the page) includes a bar for individuals who are not related to you. This means that no path can be found linking them to you in your family tree. These are individuals who may have been disconnected from the tree at some point but were never reconnected.
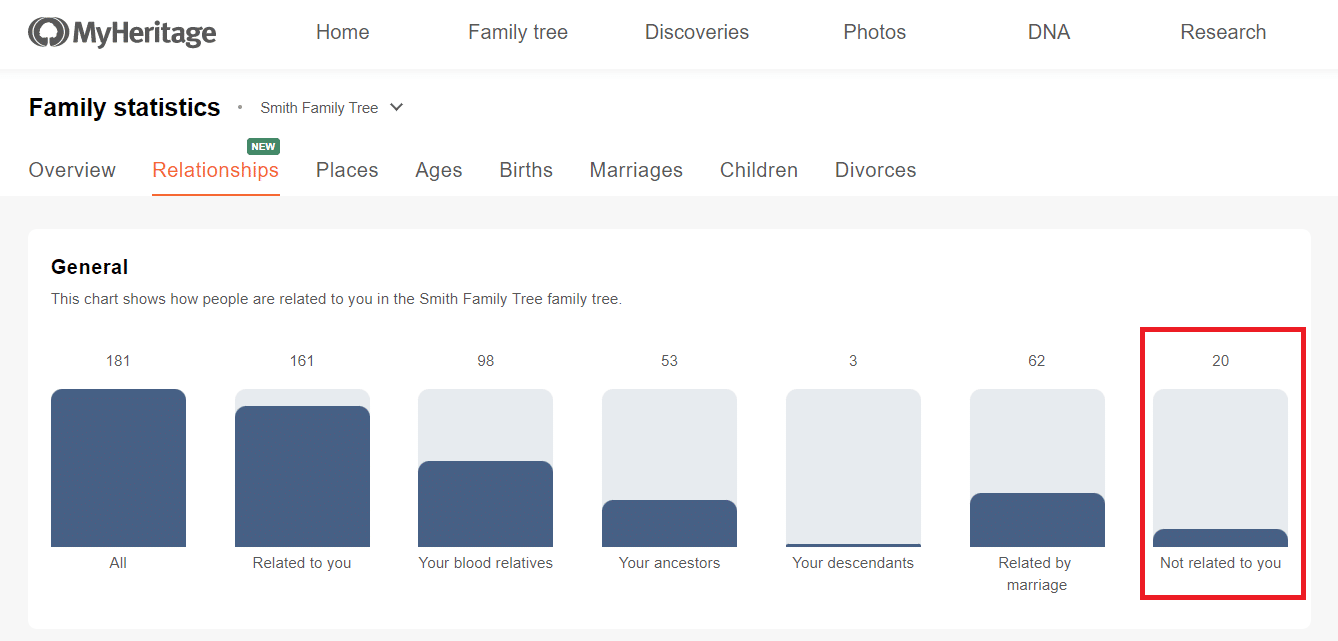
Individuals with no path are marked “Not related to you” (click to zoom)
You can click “Not related to you” to view those individuals in List view. Are they duplicates that should be deleted? Should they be reconnected somewhere else? List view can help you decide what to do with them.
Family Statistics Refresher
For those of you who may not be familiar with Family Statistics, or who haven’t used the feature in a long time, below is a recap of the different charts and metrics.
The Overview page displays charts showing a high-level breakdown of the people in your tree based on gender, whether they’re living or deceased, and their marital status.
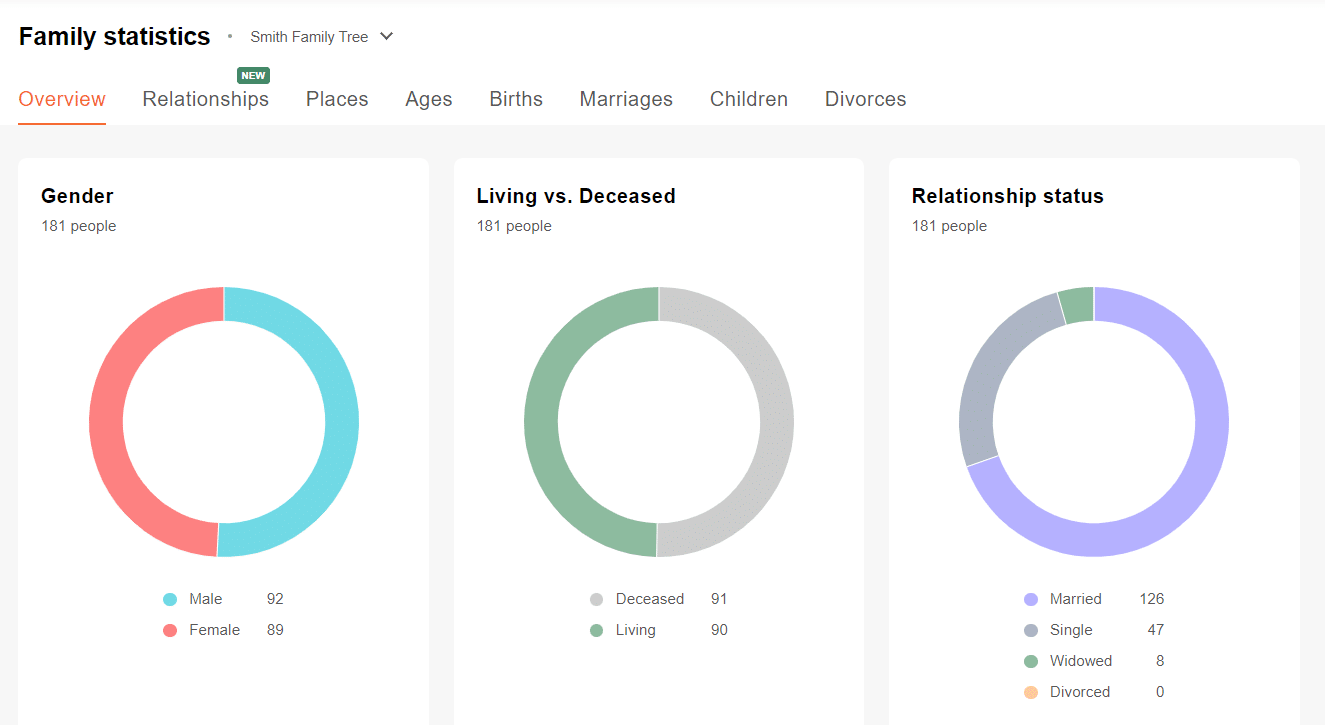
Family Statistics Overview page (click to zoom)
At the bottom of the page, you’ll see common names in your family, grouped by type. Common last names and first names are clickable. Click on a name to open List view of the family tree and display all individuals in the tree with that name. You can also hover over any name on the cards to see how many people in the family tree have that name.
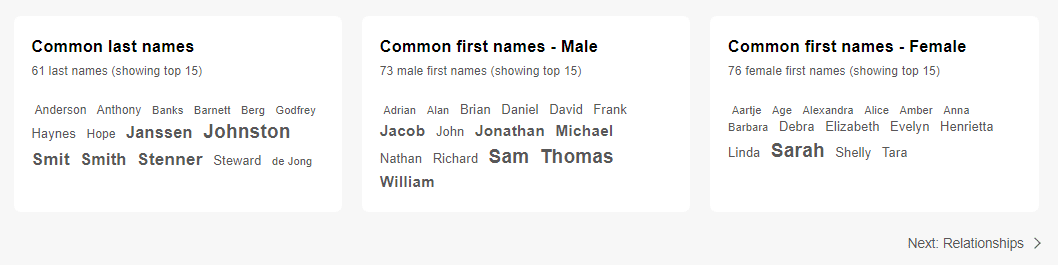
Common names are clickable (click to zoom)
The Places page displays 3 interactive maps showing places of birth, death, and residence across your family tree. Together, these maps can paint an interesting picture of your family’s migration patterns over generations.
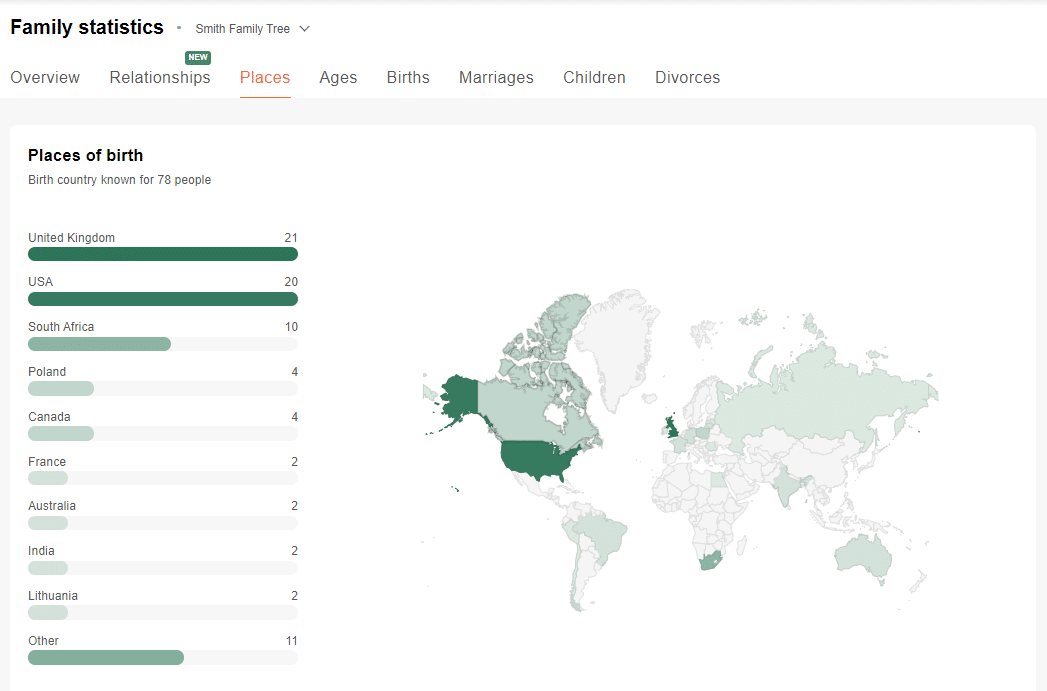
Places of birth (click to zoom)
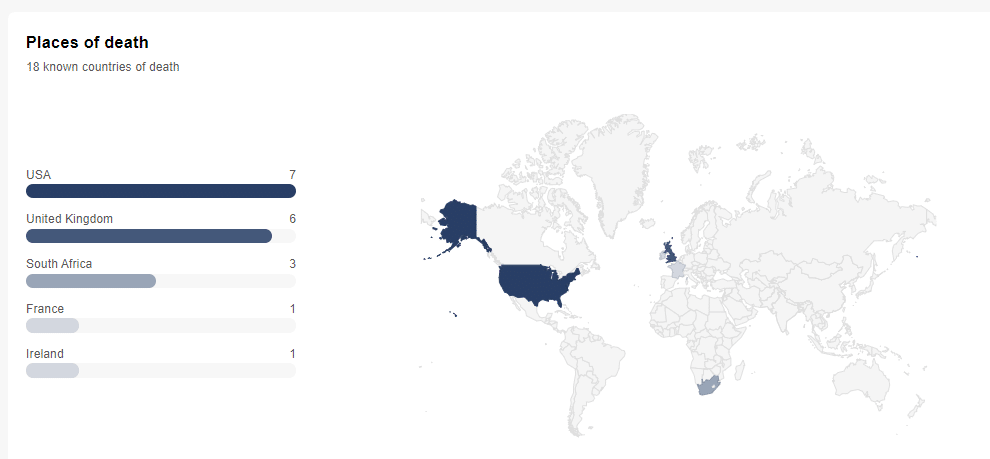
Places of death (click to zoom)
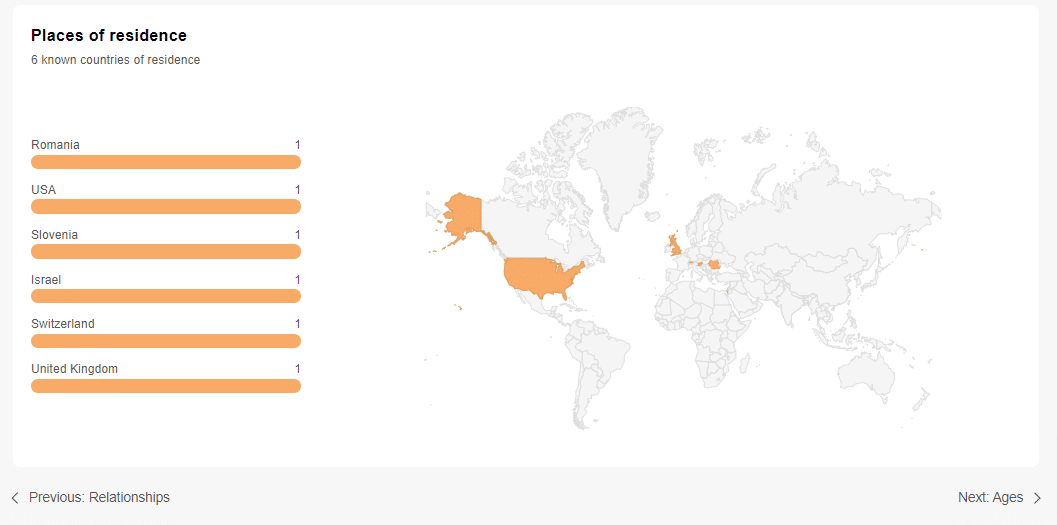
Places of residence (click to zoom)
Use the arrows at the bottom of each page to click between the different Family Statistics tabs.
The Ages page shows the age distribution across your family tree and highlights the oldest and youngest members of your family. Clicking “Top 10” will reveal the top 10 males and females in each category.
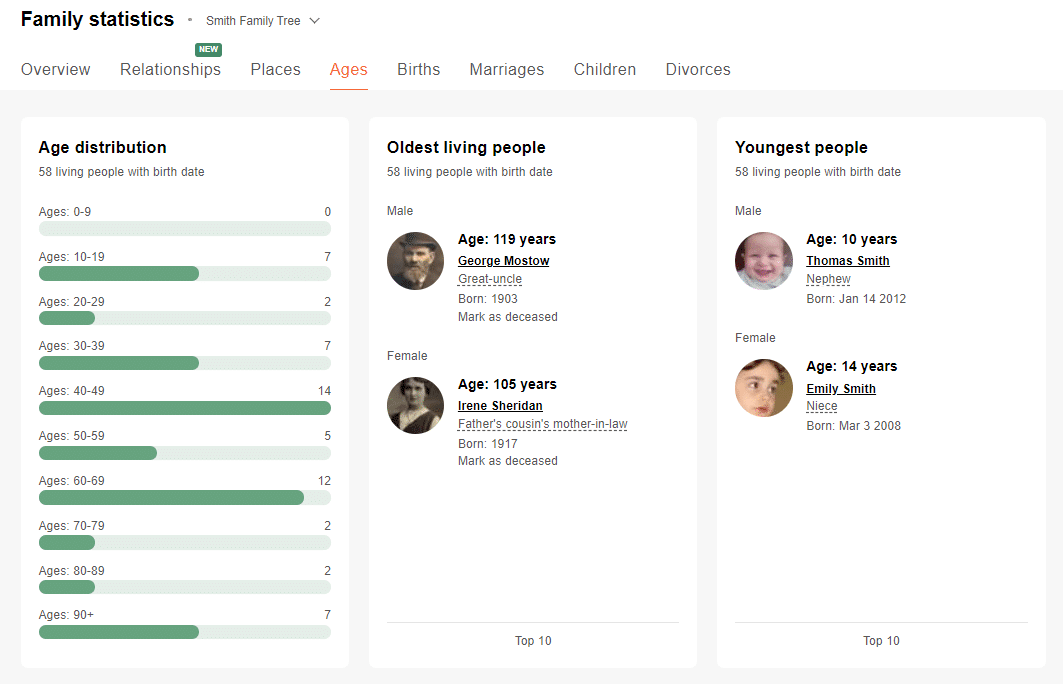
Age distribution across your family tree (click to zoom)
This page also provides insights about the average life expectancy in your family and displays the individuals with the longest and shortest lifespan. Throughout Family Statistics, some charts will have an X in the upper right corner, such as “Lived the least” in the example below. If you don’t want to see a particular chart, click the X to hide it.
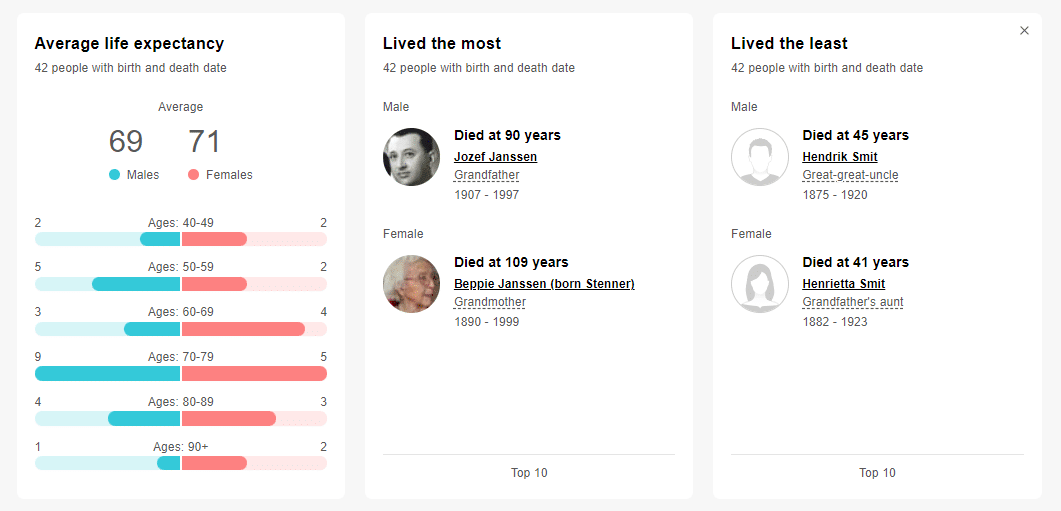
Lifespan insights on the Ages page (click to zoom)
On the Births page you’ll find the distribution of birthdates in your family tree according to month and decade, and horoscope fans will find the breakdown of individuals in the family tree according to Zodiac sign.
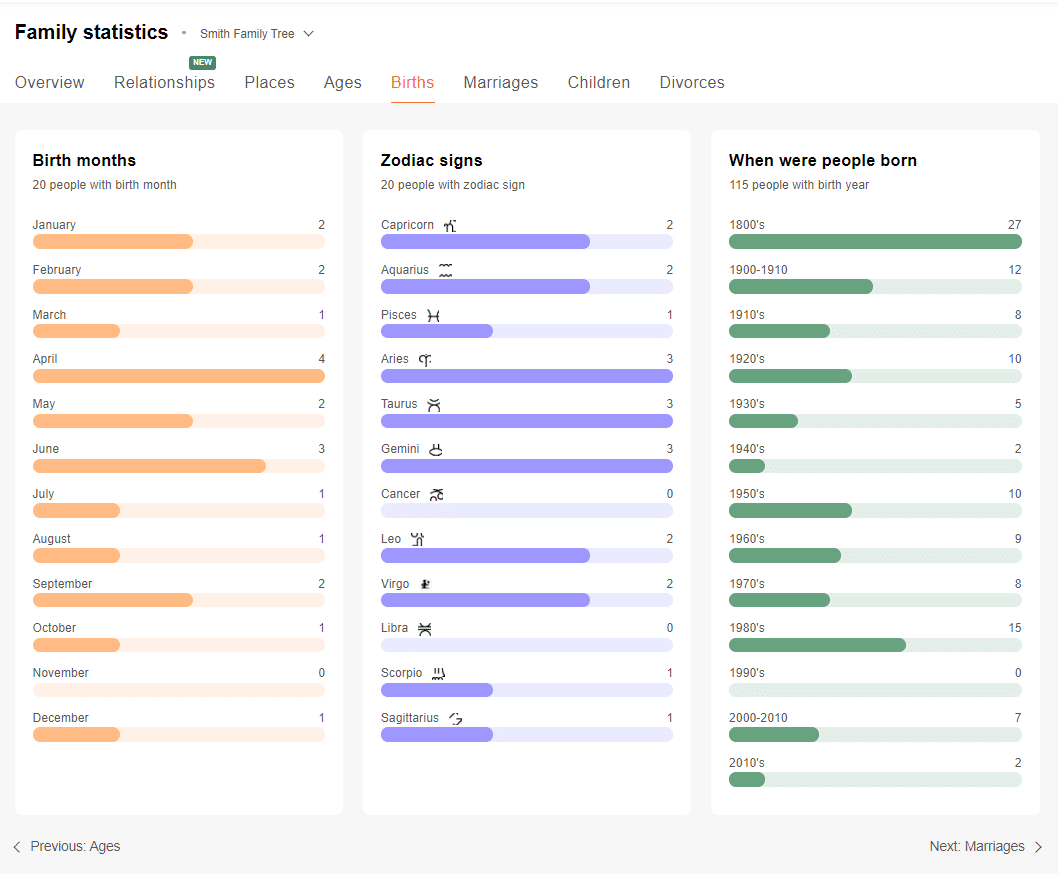
Family Statistics: Births (click to zoom)
Curious about the couples in your family tree? The Marriages page includes plenty of detailed charts highlighting the number of marriages, ages at marriage, and the duration of the relationships.
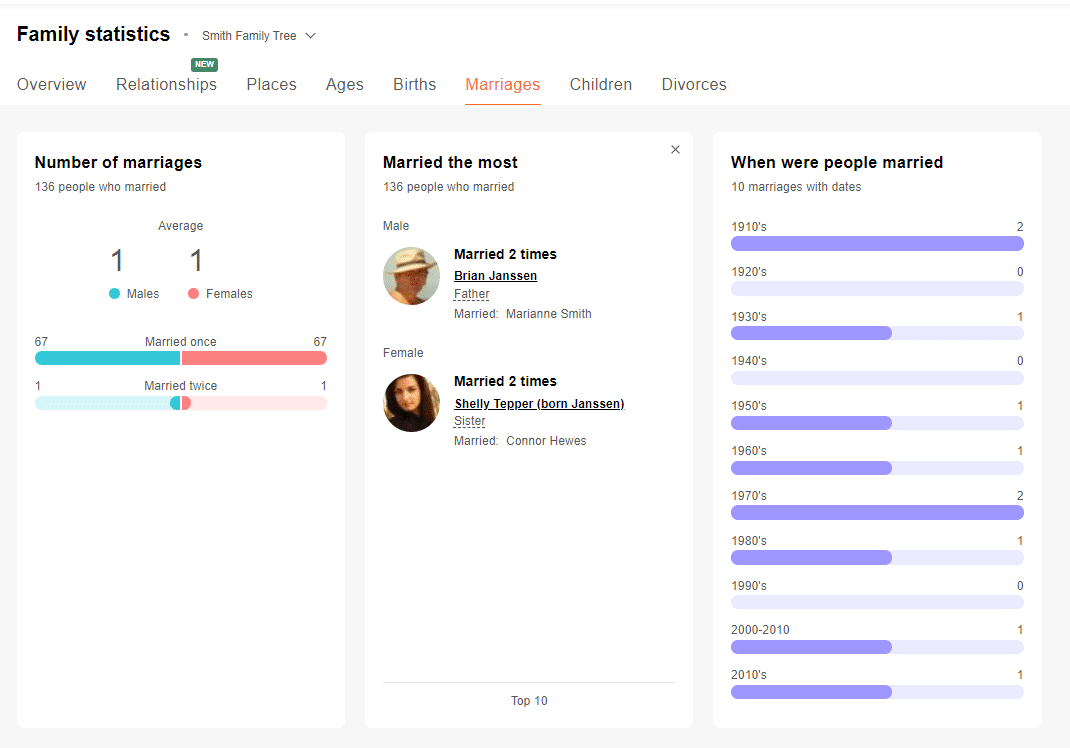
Family Statistics: Marriages (click to zoom)
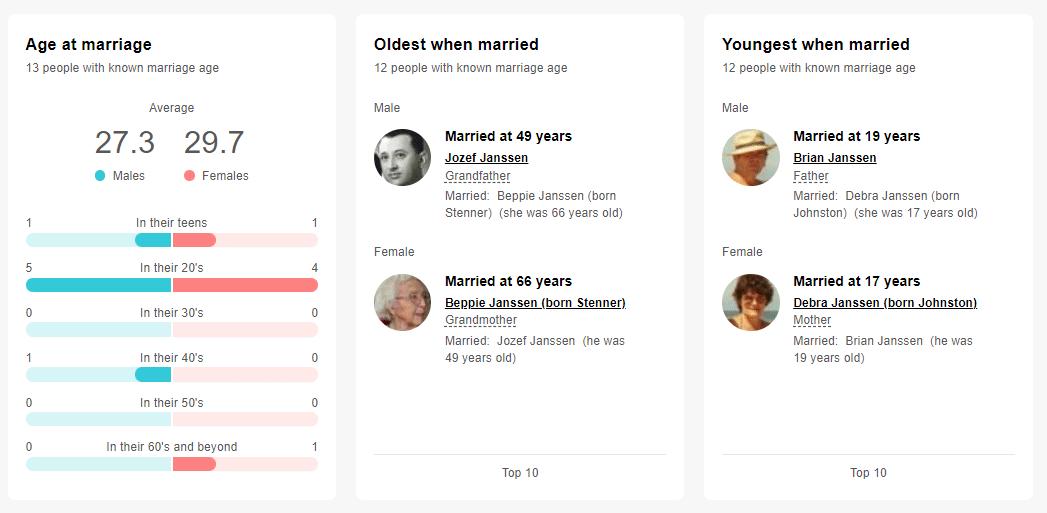
Age distribution at marriage (click to zoom)
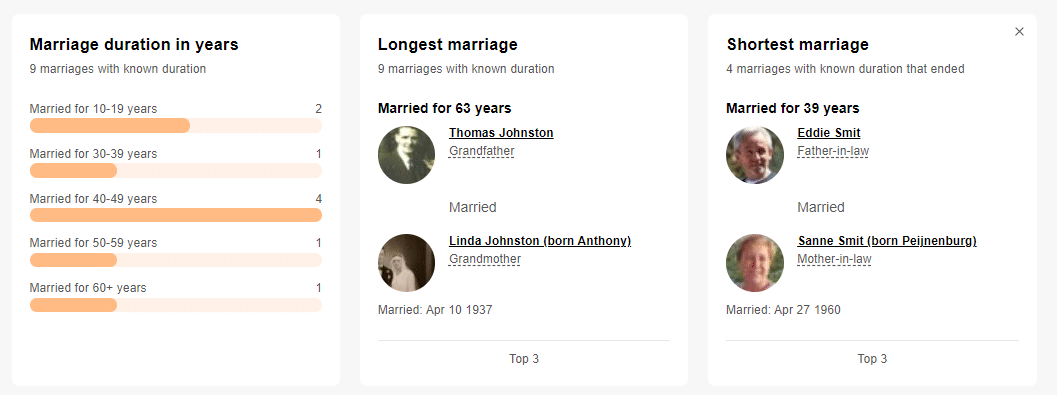
Marriage duration (click to zoom)
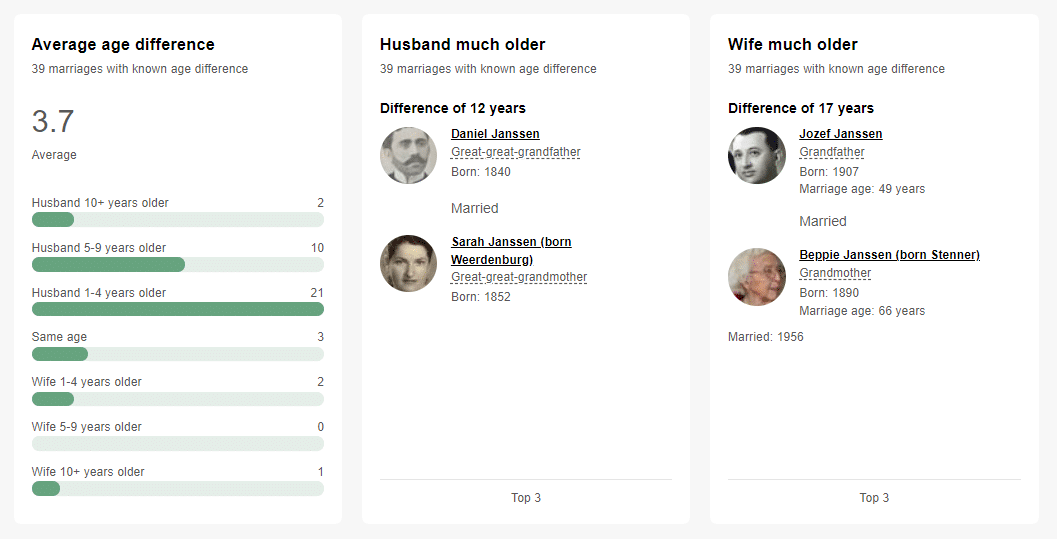
Age differences among couples (click to zoom)
The Children page reveals the average number of children per nuclear family, which couple had the most children, and which individual parented the greatest number of children.
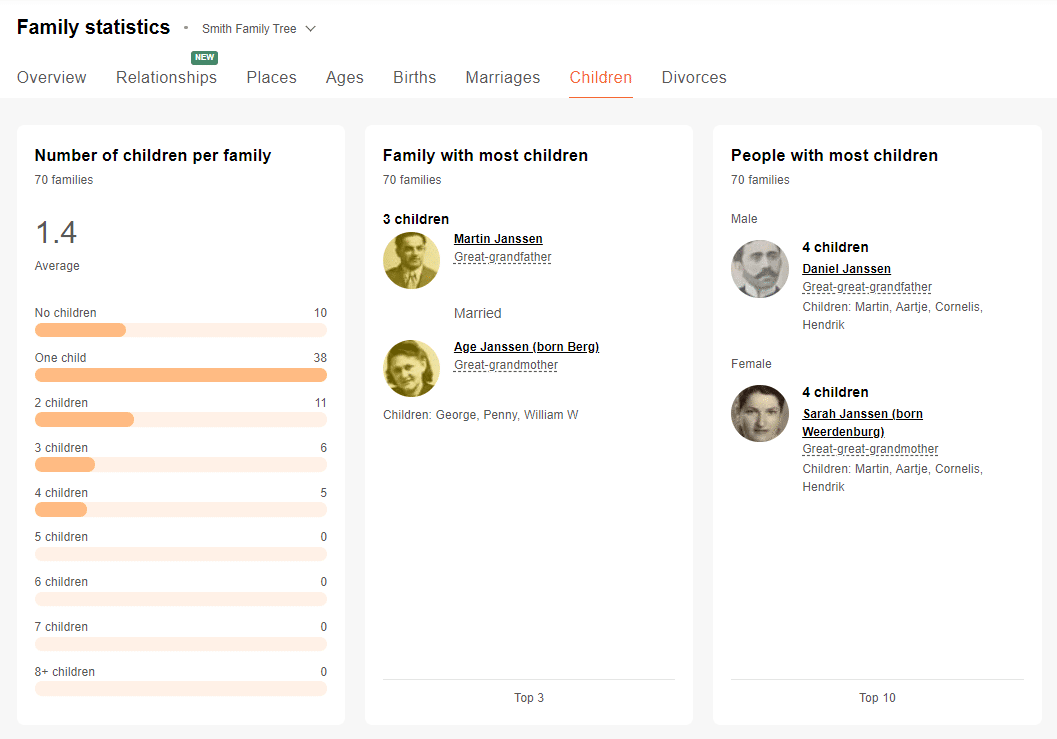
Family Statistics: Children (click to zoom)
The charts in the next row display the average age of your relatives when they had children, as well as the oldest and youngest relatives to have a child.
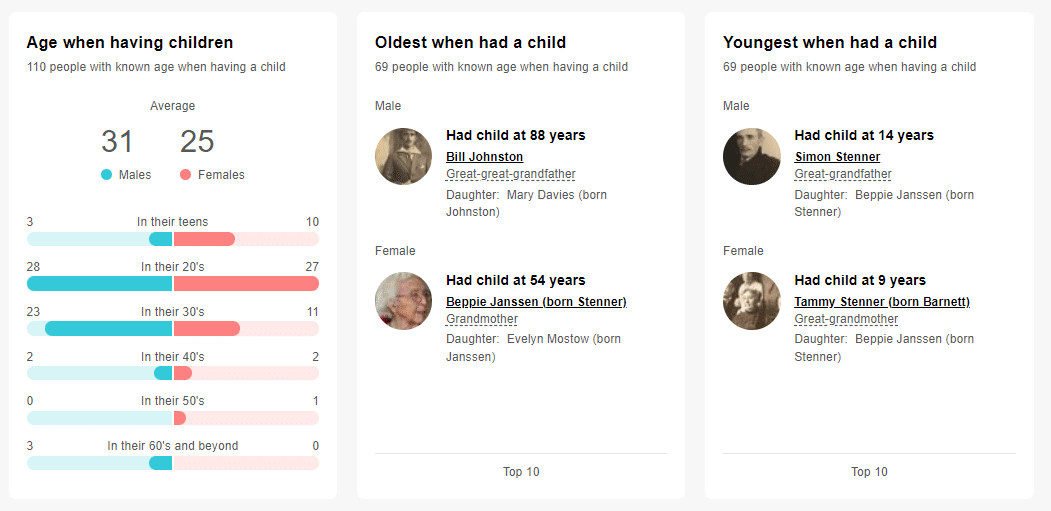
Age upon having children (click to zoom)
The last row on the page showcases the average age difference between siblings, and the largest and smallest age gaps among siblings in your family tree.
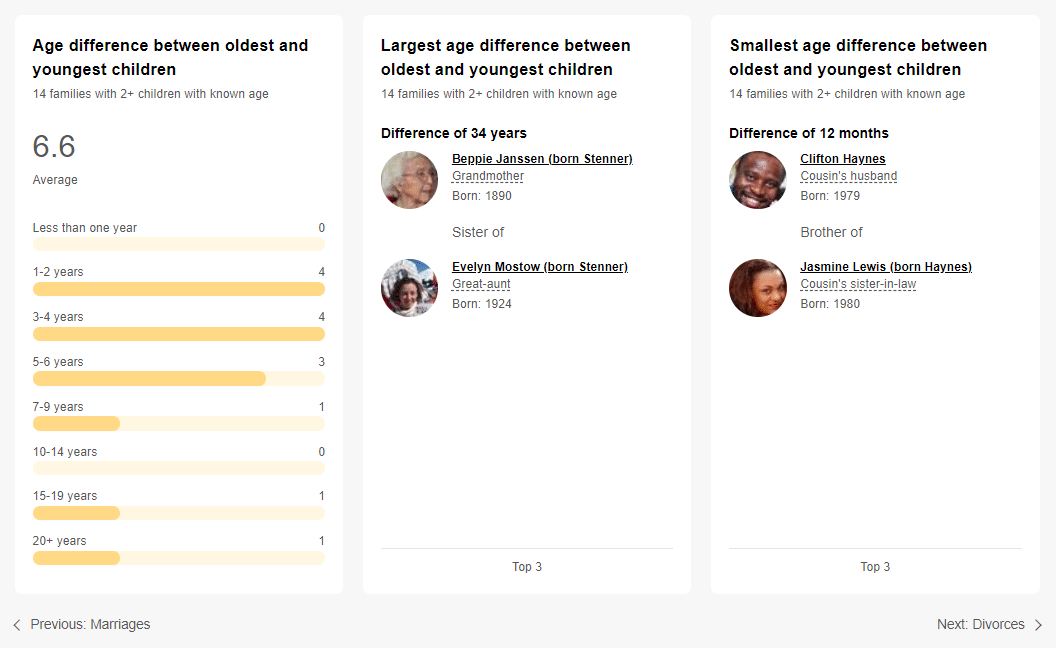
Age difference between siblings (click to zoom)
Finally, the Divorces page displays the number of divorces in your family tree, who got divorced the greatest number of times, and which longstanding marriage ended in divorce.
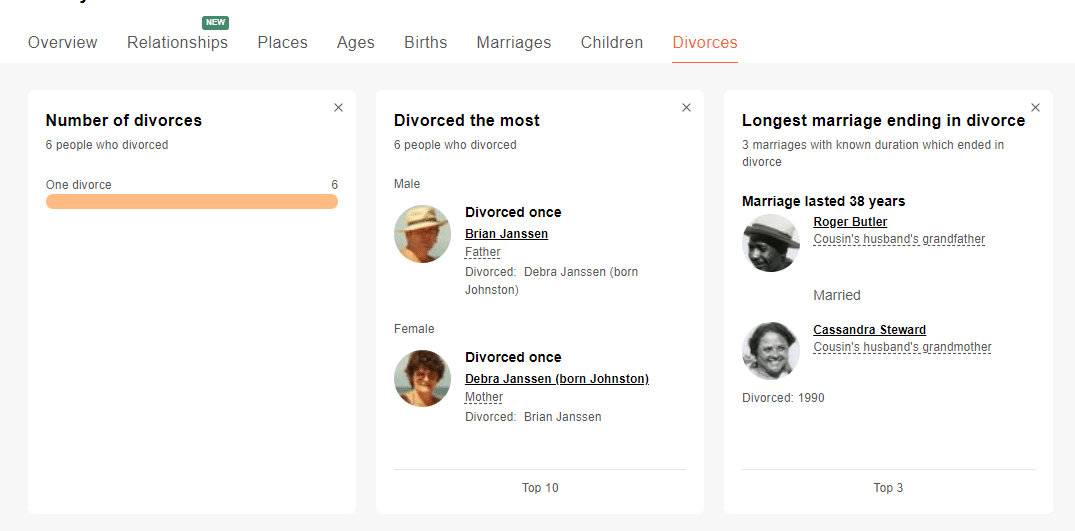
Family Statistics: Divorces (click to zoom)
You’ll also discover the age distribution of your relatives when their marriages ended.
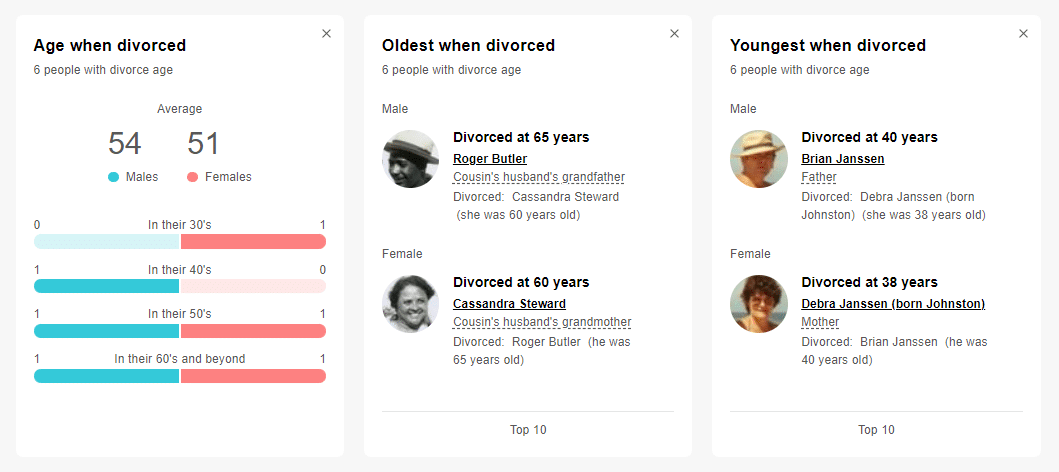
Age upon divorce (click to zoom)
Grow your family tree
Many genealogists take pride in their research and take care to ensure that their family trees are as accurate as possible. With this latest update, Family Statistics offers more ways for you to achieve higher accuracy in your family tree. In addition, the insights presented are eye-opening and a great way to introduce your family history to your family members. Next time the inquisitive minds in your family want to know which relative lived the longest, or how many people are in your maternal grandmother’s branch of your tree, Family Statistics will provide the answers in a cinch. Family Statistics is available for free on the MyHeritage website and on your mobile web browser. The more details you add to your tree, the more interesting the charts become, so grow your family tree today!
We hope you enjoy the improved Family Statistics, and we want to thank Uri Gonen from our team for being the driving force behind this feature.
Lindaura Cardoso
October 28, 2022
excelente